April 1, 2025
By The Numbers
Tim Urbanowicz, CFA
Chief Investment Strategist
Innovator Capital Management
Tariffs, tariffs, tariffs. You can’t scan a financial headline without running into them. Our team has covered their potential impact extensively, but at the end of the day, without knowing the final outcome, tariffs are very difficult to model. Consequently, they have been a persistent source of uncertainty. Are there other clues investors can be on the lookout for to get a sense of what might come next?
We've seen a lot lately: consecutive 20%+ annual gains on the S&P 500, 10% corrections, and a rough start to the year. Can recent market volatility offer any insight into what’s ahead? That’s exactly what we’re diving into this month.
Returns Following a 10% Correction
On March 13th, the S&P 500 entered correction territory, dropping 10% from February highs. With nerves running high, many investors have started shifting assets from equities to cash. But history suggests they should be doing the opposite.
Buying the dip has historically been a winning strategy. Since 1950, there have been 57 corrections of 10% or more. If an investor had bought the S&P 500 each time it dropped 10% from its peak, their average return a year later would have been a solid 15.7%. Even more compelling—12-month returns were positive 80% of the time. The worst-case scenario? A 32% drawdown during the 2008 financial crisis.
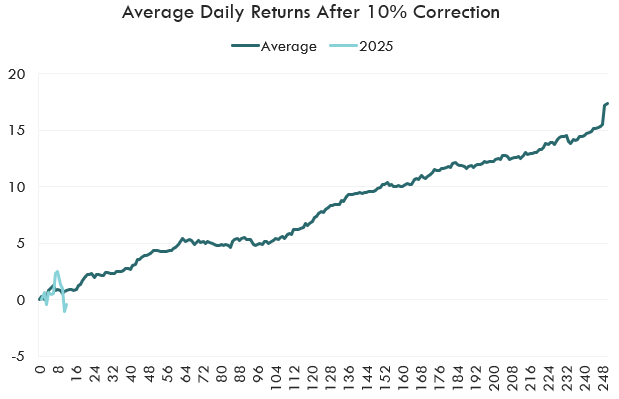
Source: Bloomberg, Innovator. Data from 12/31/1949 - 3/31/2025. Average S&P 500 Index performance following an initial 10% drawdown 12 months out. 2025 performance from 3/13/2025 - 3/31/2025. Past performance is not necessarily indicative of future results. One cannot invest directly into an index. Index performance does not account for fees and expenses.
Bottom line? Selling into fear rarely pays. More often than not, pullbacks have offered opportunity, not exit signals.
Slightly Negative Q1, Slightly Positive Year
The S&P 500 ended Q1 2025 down 4.3%, marking its first quarterly loss since Q3 2022. This was an impressive streak marking the longest stretch of positive quarterly returns since 2019, but how do markets typically perform after a weak start like this?
Since 1950, when the S&P 500 starts the year down between 0% and -5%, it has historically seen an average return of just 0.1% for the full calendar year. Climbing out of that hole isn’t easy, but looking at the data, it happens ~47% of the time, despite starting off in the hole (8 out of 17 observations).
A Lot of the “Best Days” Happen During Sell-Offs
We’ve already supported the view that remaining invested is key. In the interest of remaining balanced, we’d like to discuss our view that the classic argument about missing the “10 best days” is misleading. You’ve heard it before: missing just the 10 best days in the market crushes your returns. While this stands true, it's highly unlikely to be that unlucky—to miss only those 10 days while being invested the rest of the time. Regardless, my view is that staying invested amidst the volatility still is important.
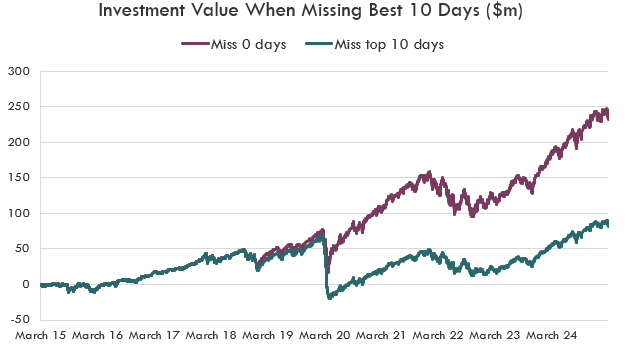
Source: Bloomberg, Innovator. Data from 2/28/2015 - 2/28/2025. S&P 500 Index performance shown. Past performance is not necessarily indicative of future results. One cannot invest directly into an index. Index performance does not account for fees and expenses.
As we've seen with this latest volatility surge, many of the biggest up days happen during sell-offs. Some occur on the way down, while others signal the start of a rebound. Up to this point, as the S&P 500 approached a 10% correction, we saw 5 days with gains of 1% or more, 3 days with gains of 1.5% or more, and 1 day where the index surged 2% or more.
During the pandemic, we saw multiple 9%+ rallies—some before the market bottomed in March 2020 and others as recovery took hold. Trying to distinguish between a dead cat bounce and a true recovery is often a losing game.
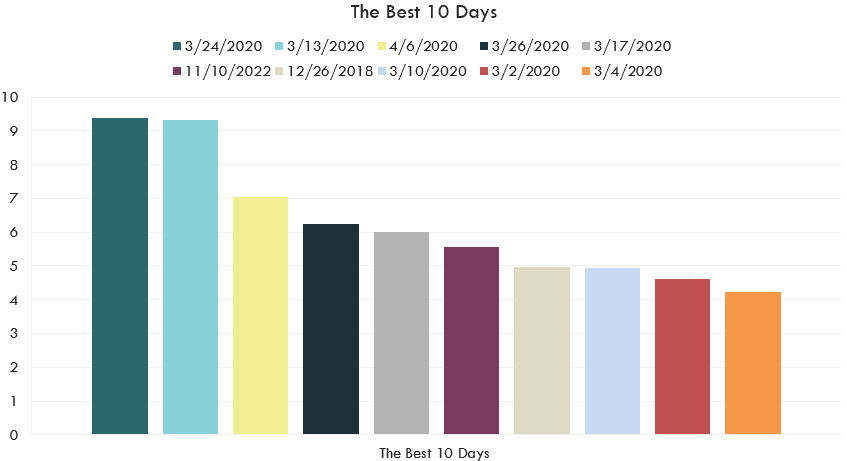
Source: Bloomberg, Innovator. 10 greatest 1-day percentage returns on the S&P 500 Index since 12/31/2017. Past performance is not necessarily indicative of future results. One cannot invest directly into an index. Index performance does not account for fees and expenses.
Bottom line? Staying invested through market turmoil is crucial, as many of the “best days” happen during or shortly after major sell-offs.
Final Thoughts
Tariffs appear likely to continue fueling uncertainty and volatility, making it tough to predict where the market is headed. Yet, given what history has shown us about corrections, weak starts to the year, and market rebounds, one thing remains clear: staying invested has been historically rewarding.
This material contains the current research and opinions of its author, which are subject to change without notice. This material is not a recommendation to participate in any particular trading strategy and does not constitute an offer or solicitation to purchase any investment product. Unless expressly stated to the contrary, the opinions, interpretations, and findings herein do not necessarily represent the views of Innovator Capital Management, LLC (“Innovator”) or any of its affiliates.
This material is provided for informational purposes only. References to specific securities in this material are provided for informational purposes only and do not constitute a recommendation for any security. Readers should consult with their investment and tax advisers to obtain investment advice and should not rely upon information published by Innovator or any of its affiliates. Past performance does not guarantee future results. The information herein represents an evaluation of market conditions as of the date of publishing, is subject to change, and is not intended to be a forecast of investment outcomes.
This material is provided for informational purposes only and is made available on an “as is” basis, without representation or warranty. The information herein is only current as of the date indicated and may be superseded by subsequent market events or for other reasons. This material represents an evaluation of market conditions as of the date of publishing, is subject to change without notice, and is not intended to be a forecast of investment outcomes. Innovator specifically disclaims all warranties, express or implied, to the full extent permitted by applicable law, regarding the accuracy, completeness, or usefulness of this information, including any forecasts or price targets contained herein, and assumes no liability with respect to the consequences of relying on this information for investment or other purposes.
Investing involves risk. Principal loss is possible. Past performance is not necessarily indicative of future results. One cannot invest directly into an index. Index performance does not account for fees and expenses.
Certain information herein contains forward-looking statements such as “will,” “may,” “should,” “expect,” “target,” “anticipate,” or other variations of these statements. Forward-looking statements are based upon assumptions which may not occur, while other conditions not taken into account may occur. Actual events or results may differ materially from those contemplated in such forward-looking statements. The forward-looking statements contained herein do not constitute, and should not be relied upon as, investment advice. Such forward-looking statements are not necessarily based upon explicit criteria and assumptions, but rather, represent the opinions of the author. Projections, outlooks, and forecasts do not reflect actual investment results, are not guarantees of future results, and are hypothetical in nature.