November 8, 2024
Small-Caps & Interest Rates: Debunking Common Assumptions
Tom O'Shea, CFA
Director of Investment Strategy
Innovator Capital Management
Financial markets are benefiting from tailwinds in several areas. From a monetary policy standpoint, the Federal Reserve recently cut rates by a total of 0.75% across consecutive meetings, joined by rate cuts from other major central banks. U.S. economic growth remains solid, with Q3 GDP at 2.8%. Now, with the election results behind us, many investors view the new regime as a green light for risk assets. Following the election, notable winners have emerged: the S&P 500 climbed 2.5%—the largest one-day gain after an election on record. Financial services and Bitcoin, buoyed by expectations of looser regulations, surged 6.1% and 9.8%, respectively. Small-cap equities were also among the winners, rising 5.8%.
Are Small-Cap Equities Here to Stay?
Since 1979, small-cap and large-cap equities have passed the performance baton back and forth over extended periods. In the past 10 years, large caps have outperformed by an annualized 5.4%, leading some to question the persistence of the size premium proposed in the early 1990s by Eugene Fama and Kenneth French. Some argue that the evolving private equity market may explain the erosion in small-cap performance relative to larger companies. Recently, restrictive Federal Reserve rates have particularly weighed on small-cap companies with more debt-sensitive balance sheets. With the Fed now easing rates, many believe small-caps may be poised to break the decade-long streak of large-cap dominance.
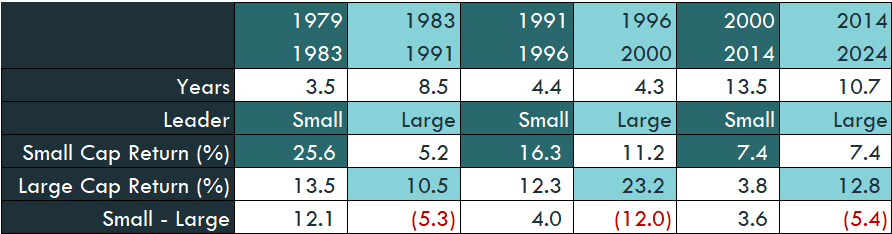
Source: Bloomberg, Innovator Research & Investment Strategy. Small-cap performance tracks the Russell 2000 Index while large-cap performance tracks the Russell 1000 Index. Past performance is not indicative of future results. One cannot invest directly into an index.
Average Outperformance During Cutting Cycles
In my own research on small-cap performance, I’ve come across the chart below more than a handful of times as rationale to initiate a position in small-caps. As the Fed signaled its intent to cut rates heading into September, financial headlines highlighted the relationship between rate cuts and small-cap excess performance over large-caps. The chart below illustrates this point. Over various Federal Reserve cutting cycles going back to 1980, small-caps have outperformed large-caps 6-months, 1-year, and 1.5 years after the first cut on average. While these averages might seem compelling, relying on them alone could be misleading.
Small vs. Large-Cap Performance in Recent Cutting Cycles
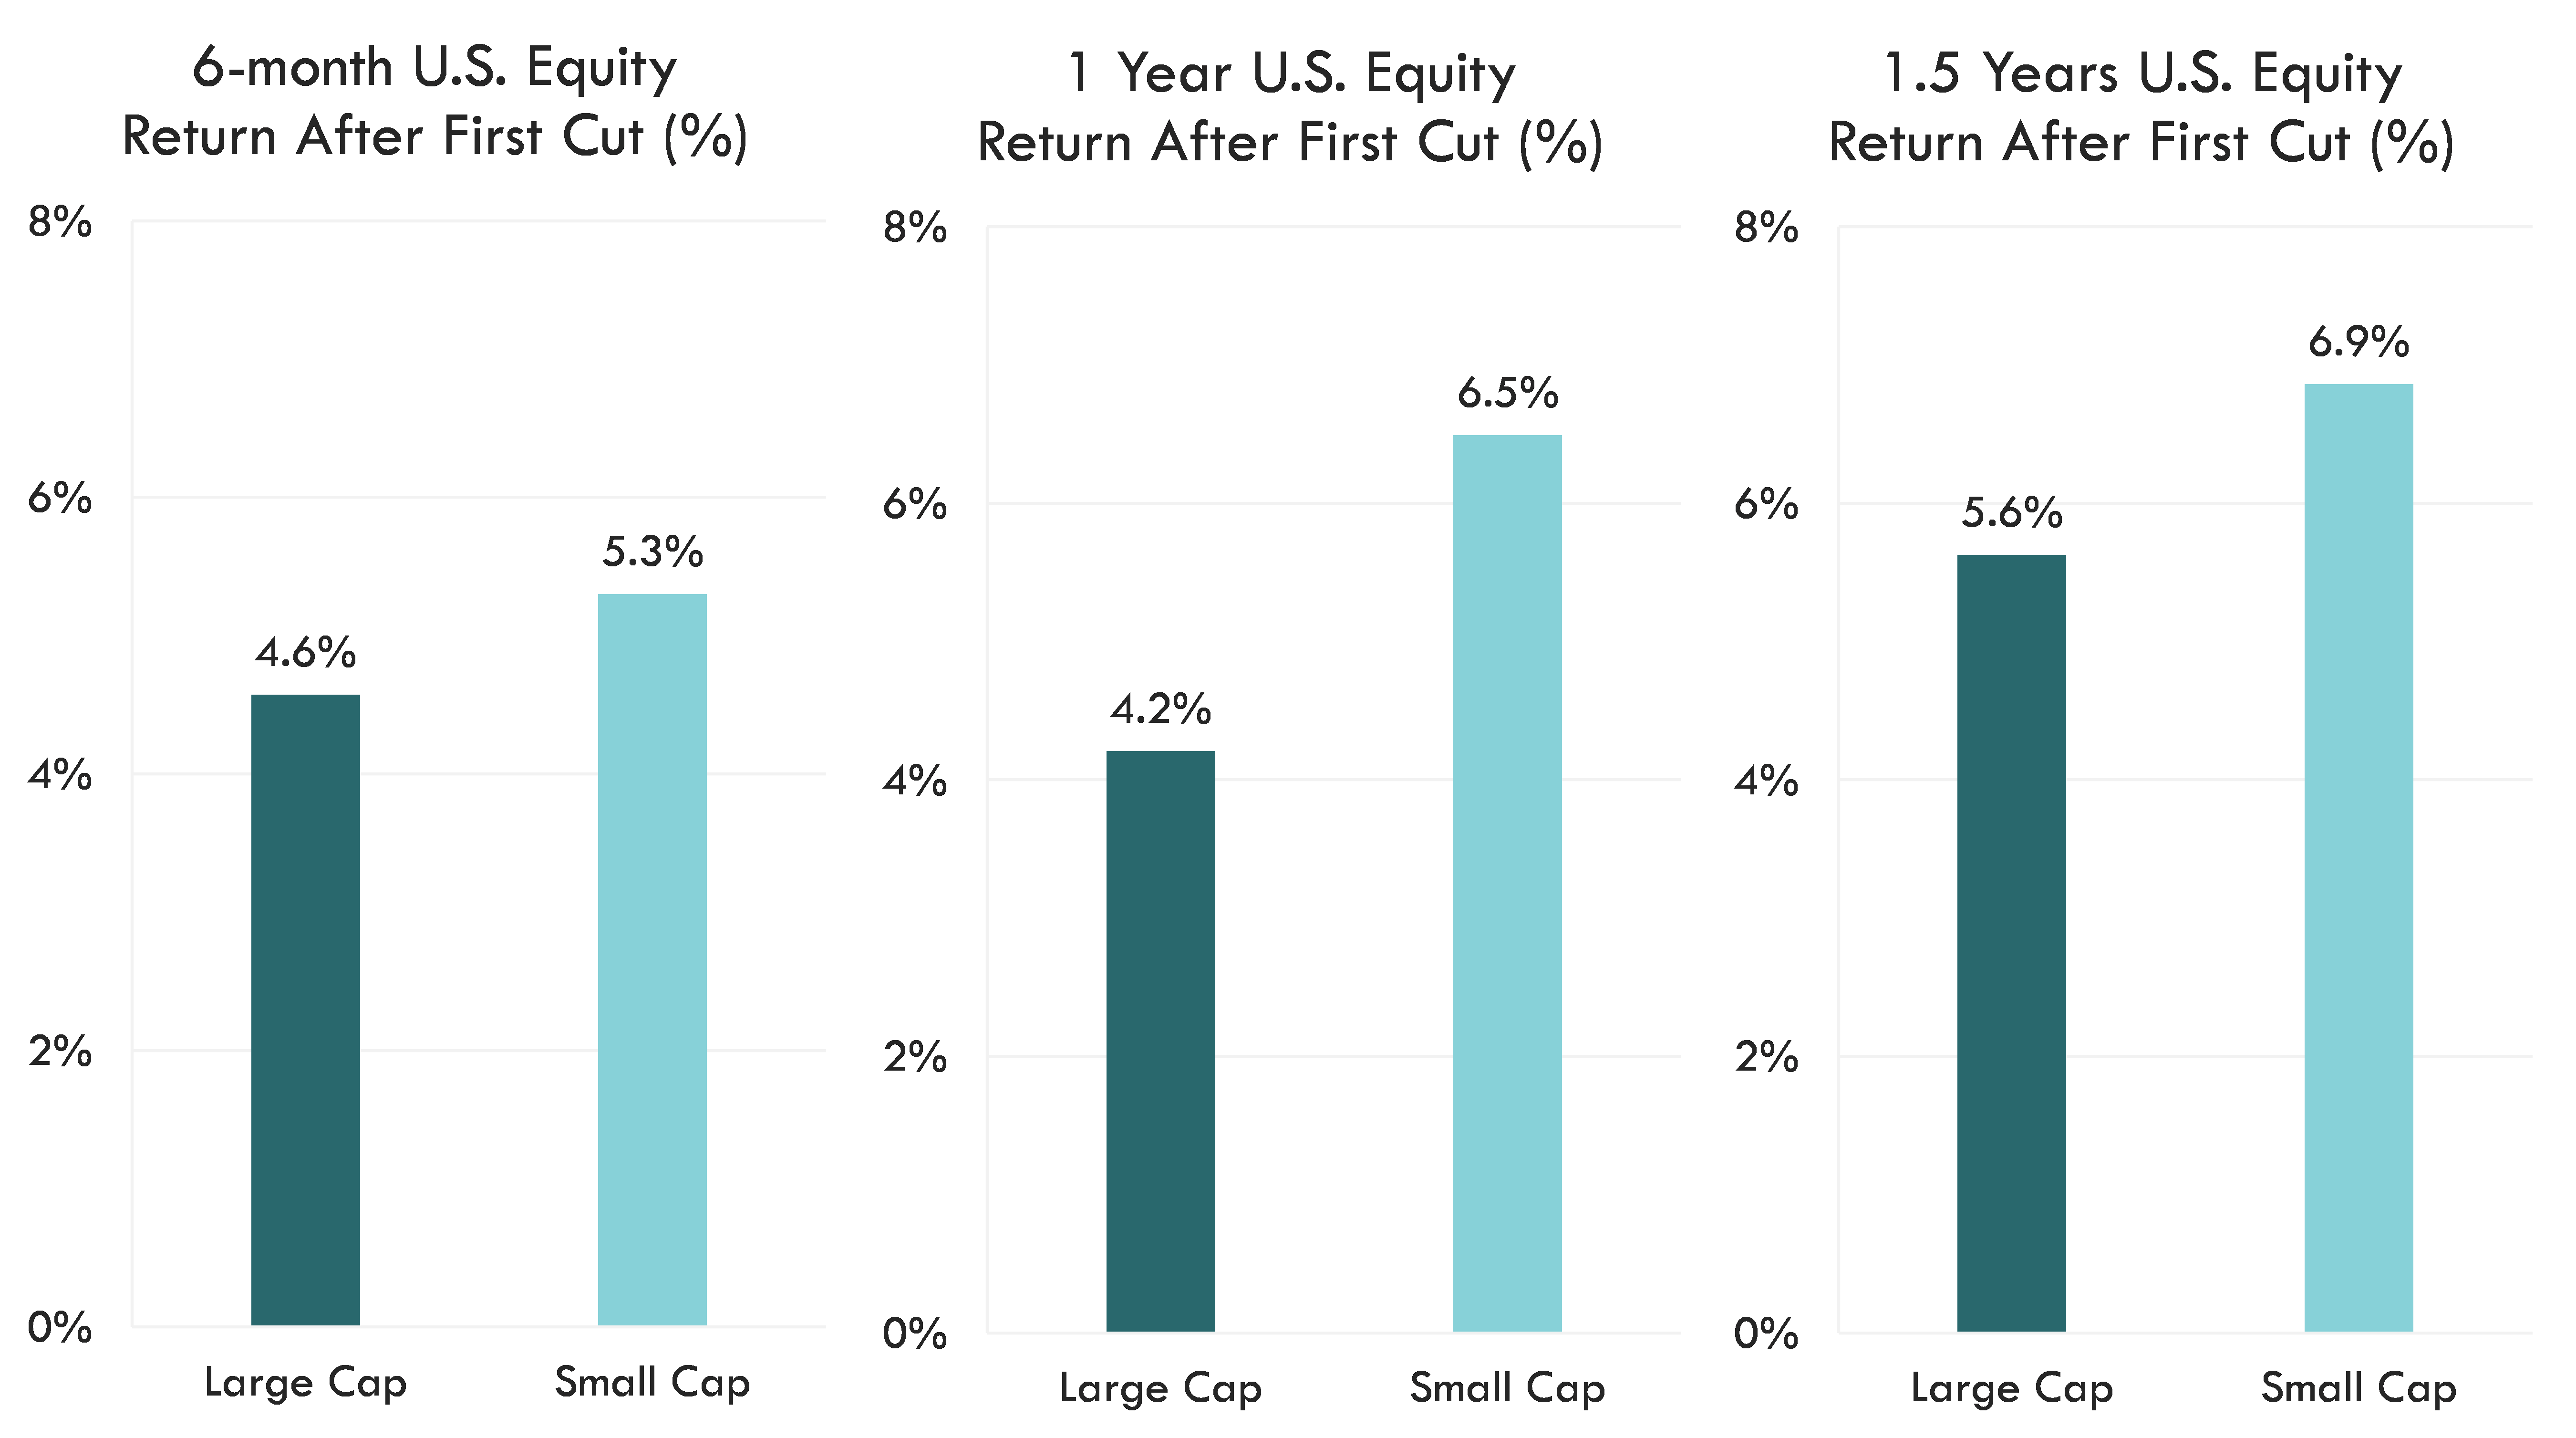
Source: Bloomberg, Innovator Research & Investment Strategy. Small-caps are represented by the Russell 2000 Index. Large-caps are represented by the Russell 1000 Index. Performance evaluated for eight cutting cycles following first cut dates ranging from 4/1/1980 – 7/31/2019. Past performance is not indicative of future results. One cannot invest directly into an index.
A deeper examination of small-cap versus large-cap performance during the last eight rate-cutting cycles reveals that large-caps actually outperformed small-caps in six out of eight instances one year after the initial cut. In fact, most of the average outperformance in previous data stems from one standout cycle in 1980. Excluding this potential outlier dramatically shifts the average, favoring large-caps instead.
Small vs. Large-Cap Performance in Recent Cutting Cycles (ex-1980)
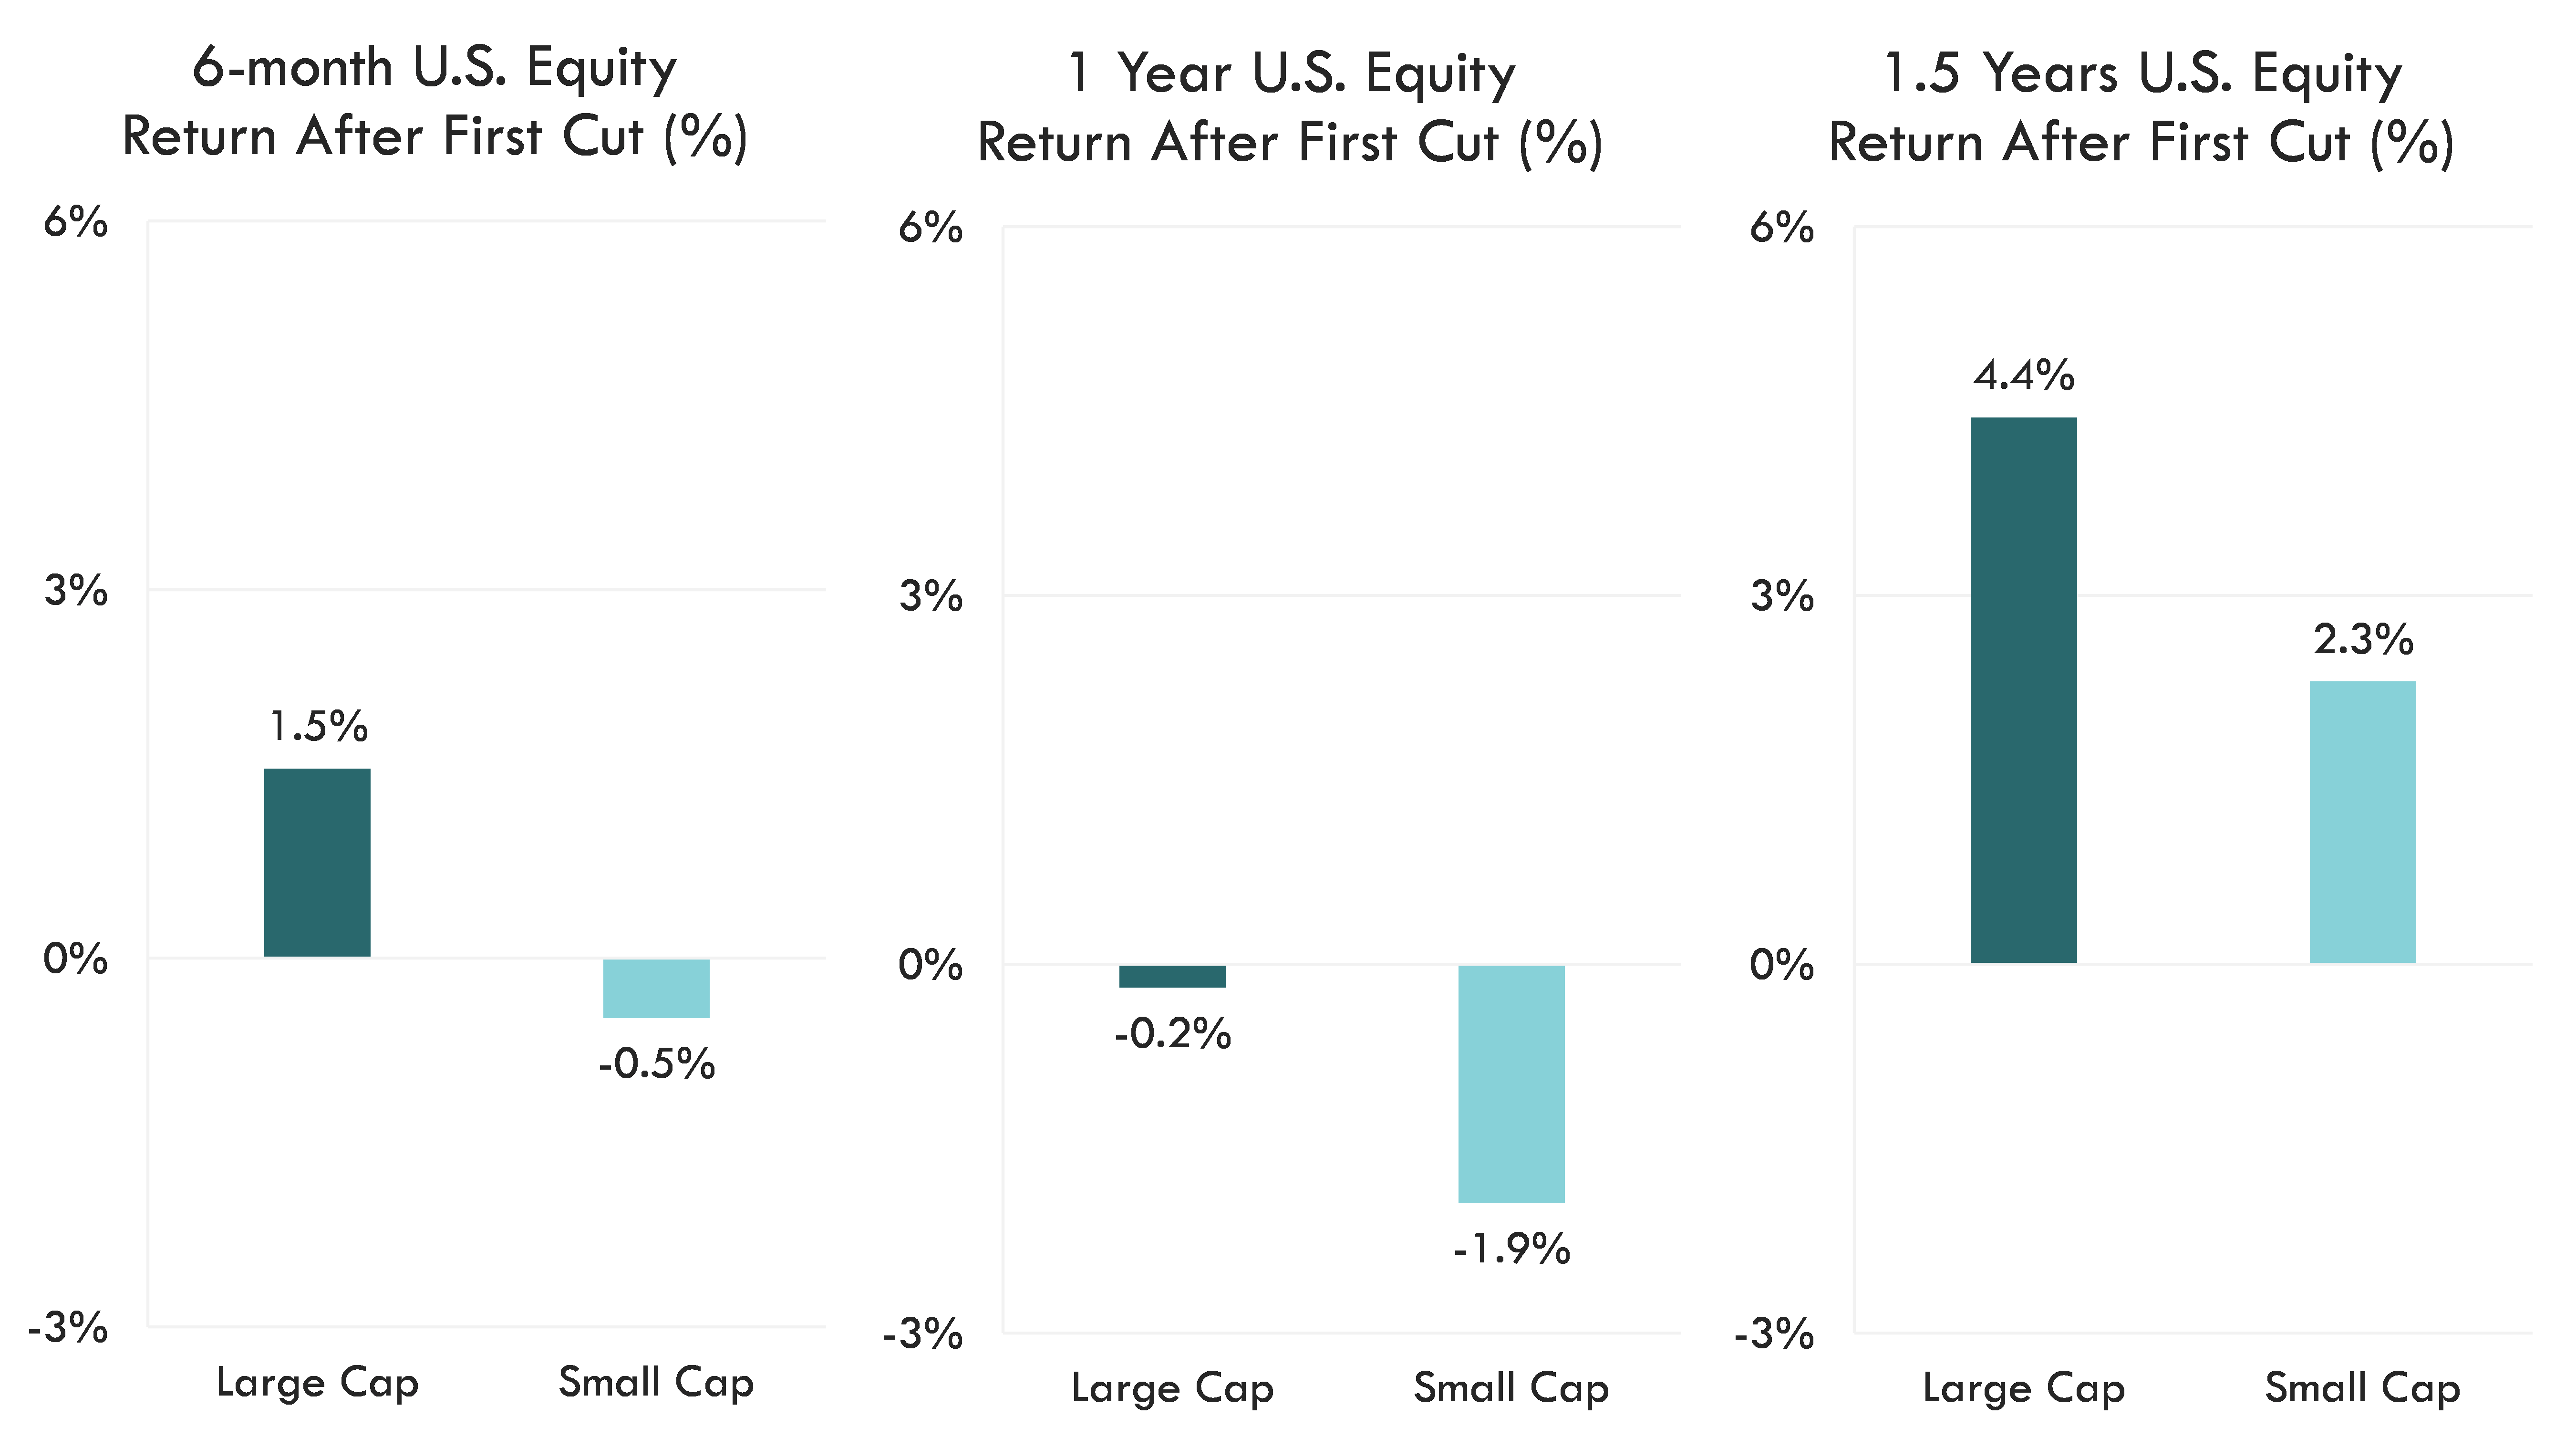
Source: Bloomberg, Innovator Research & Investment Strategy. Small-caps are represented by the Russell 2000 Index. Large-caps are represented by the Russell 1000 index. Performance evaluated for eight cutting cycles following first cut dates ranging from 6/1/1981 – 7/31/2019. Past performance is not indicative of future results. One cannot invest directly into an index.
A Closer Look at Rate Policy and Small-Cap Returns
Had there been a strong historical link between the Fed’s rate policy and small-cap performance, we would expect to see a discernable pattern in the data, with returns generally trending from the top left to the bottom right. However, a scatterplot of rolling 1-year periods, showing changes in the Fed Funds rate on the x-axis and small-cap returns on the y-axis, resembles more of a Rorschach test than a clear trend. For example, when the Fed lowered rates by 3%-6%, small-cap returns ranged widely from -38% to 92%, with positive outcomes just under half the time. This lack of correlation suggests that other factors may be more influential drivers of small-cap performance.
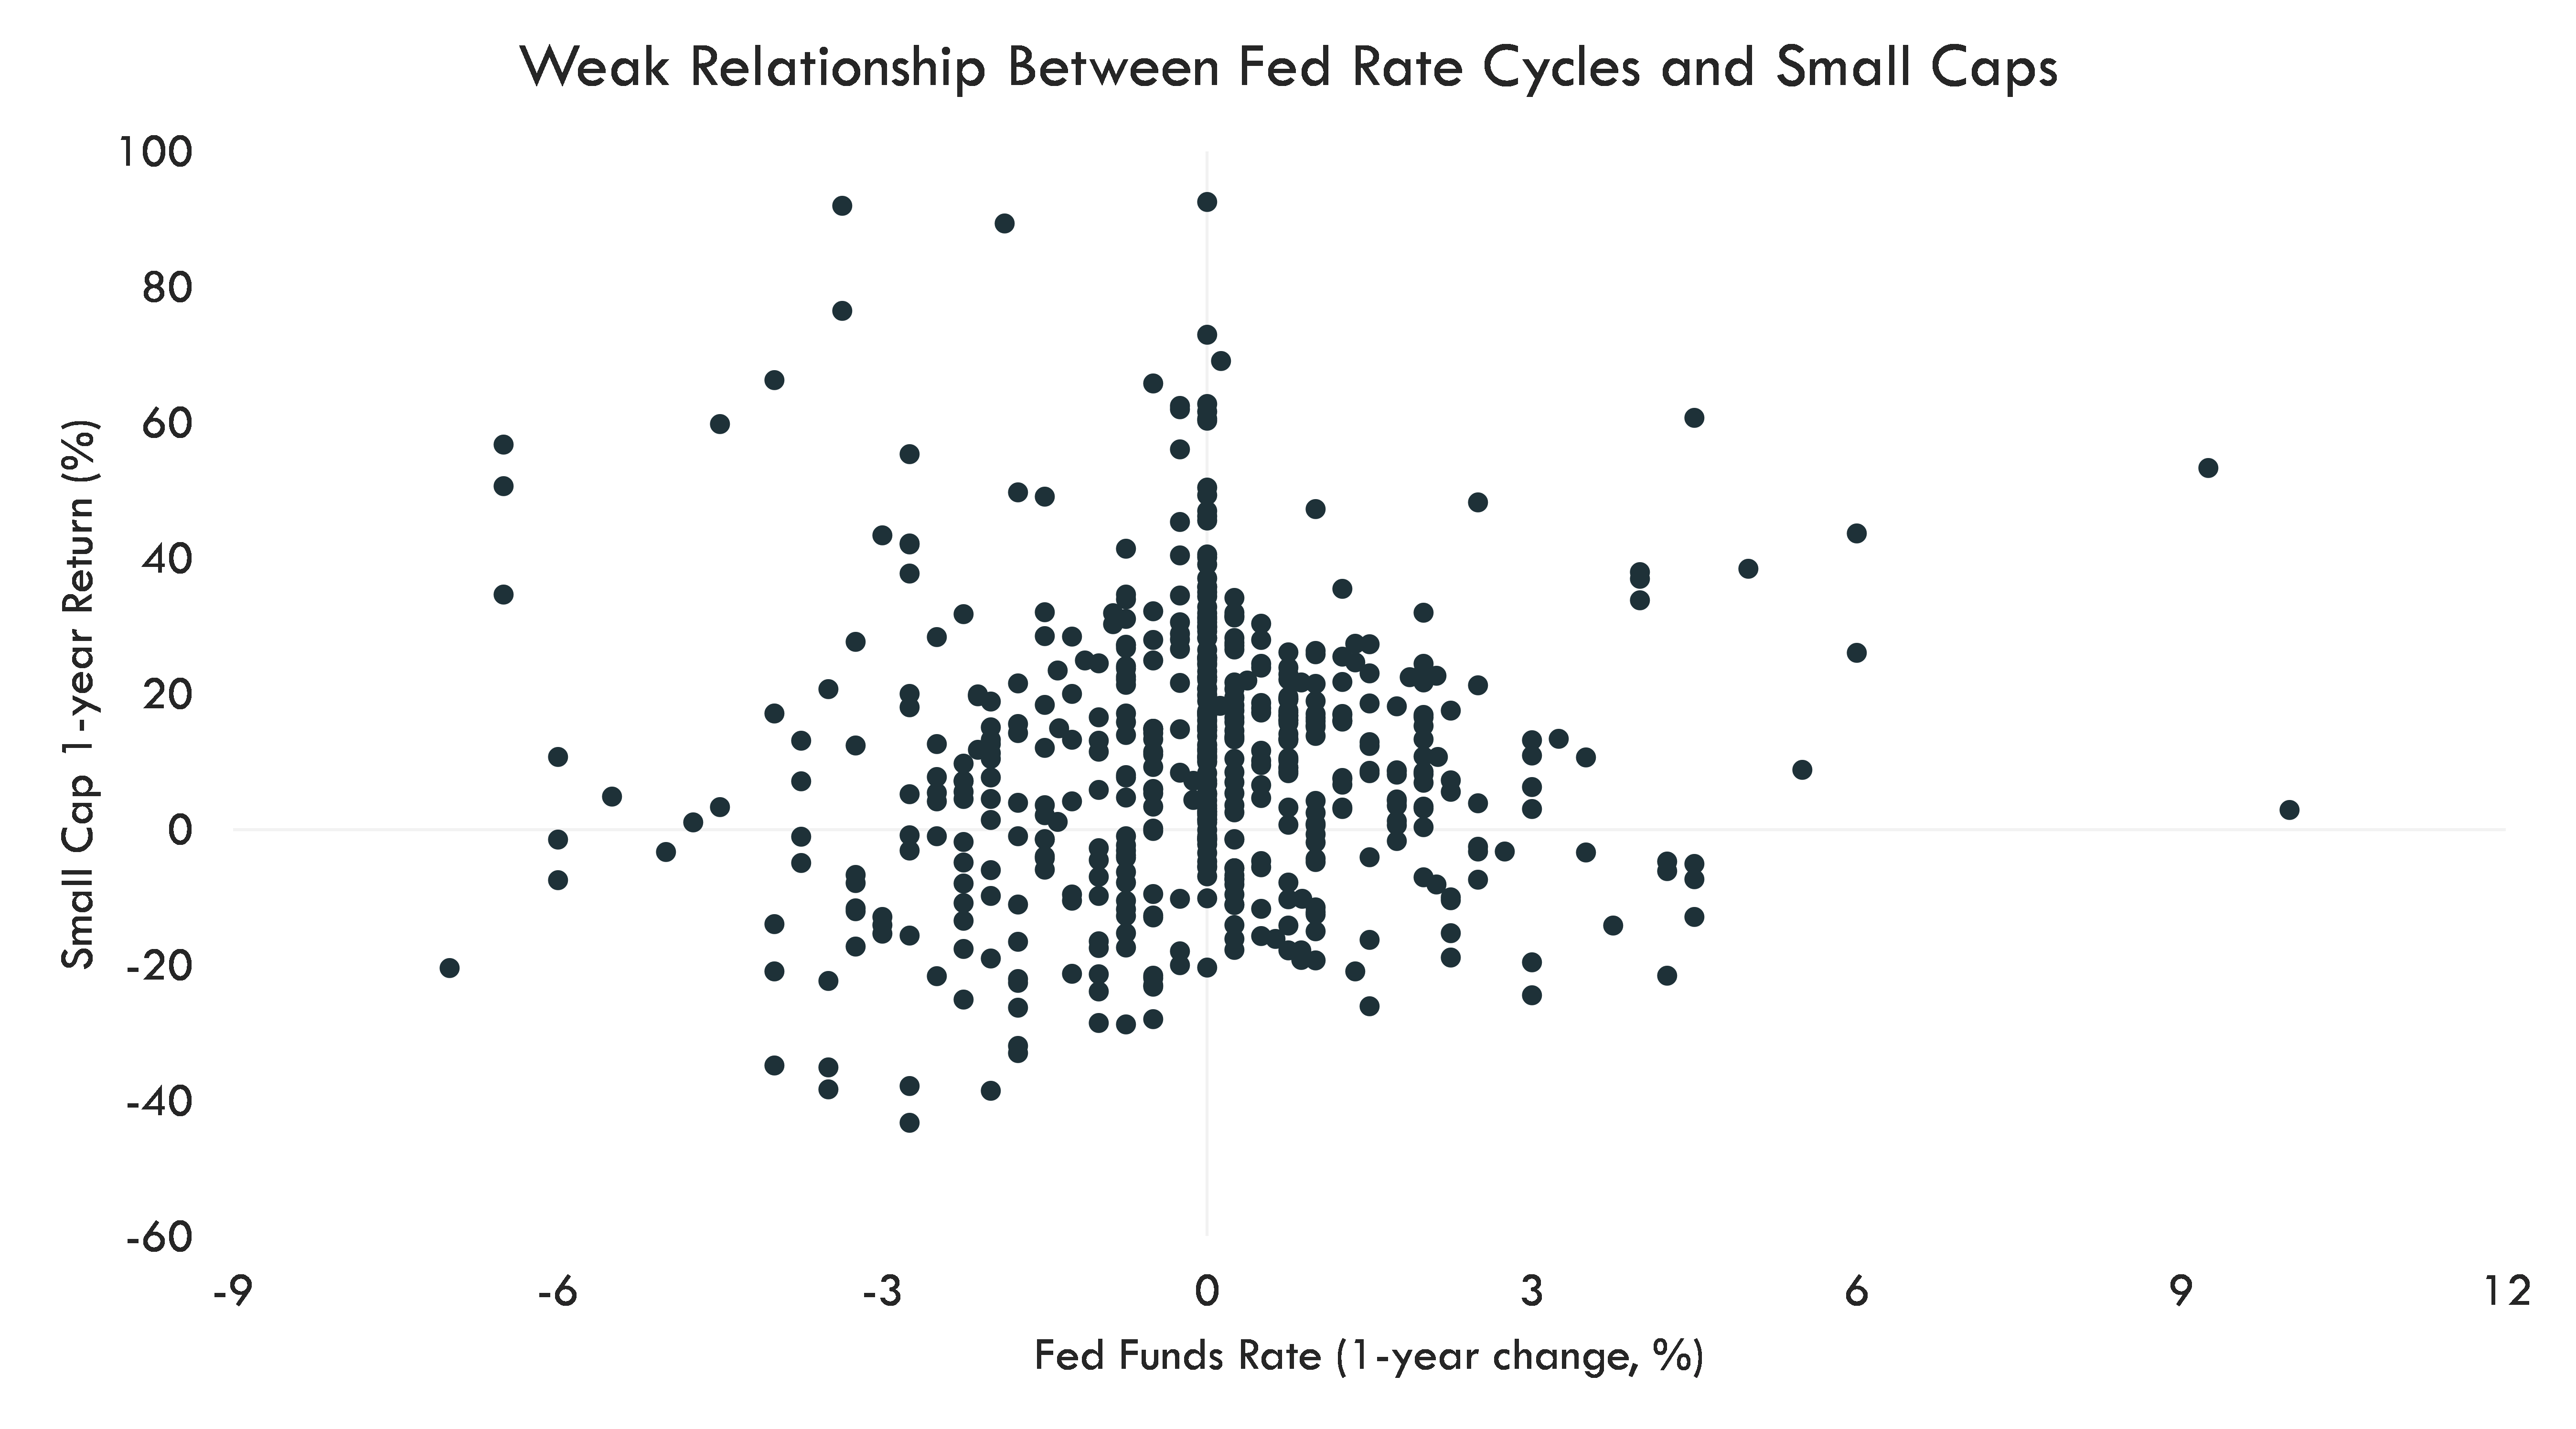
Source: Bloomberg L.P., Innovator Research & Investment Strategy. Small cap equity returns are represented by the Russell 2000 Index. Rolling 1-year small-cap performance is shown relative to rolling 1-year change in the Fed Funds Rate. Monthly data from 12/31/1990 - 10/31/2024. Past performance is not indicative of future results. One cannot invest directly into an index.
The Role of Economic Growth
While rate cuts may provide a short-term boost to small-caps, sustained performance typically requires solid earnings and a strong economic environment. The ISM Purchasing Managers’ Index (PMI) is a key gauge of U.S. economic health, with readings above 50 indicating an expanding manufacturing sector, and readings below signaling contraction. Historically, movements in the ISM often precede shifts in small-cap performance, and positive performance is common when the ISM posts readings above 50. With the ISM trending lower since a peak in early 2021, investors are now closely watching for a turnaround that could act as a positive signal for small-cap stocks.
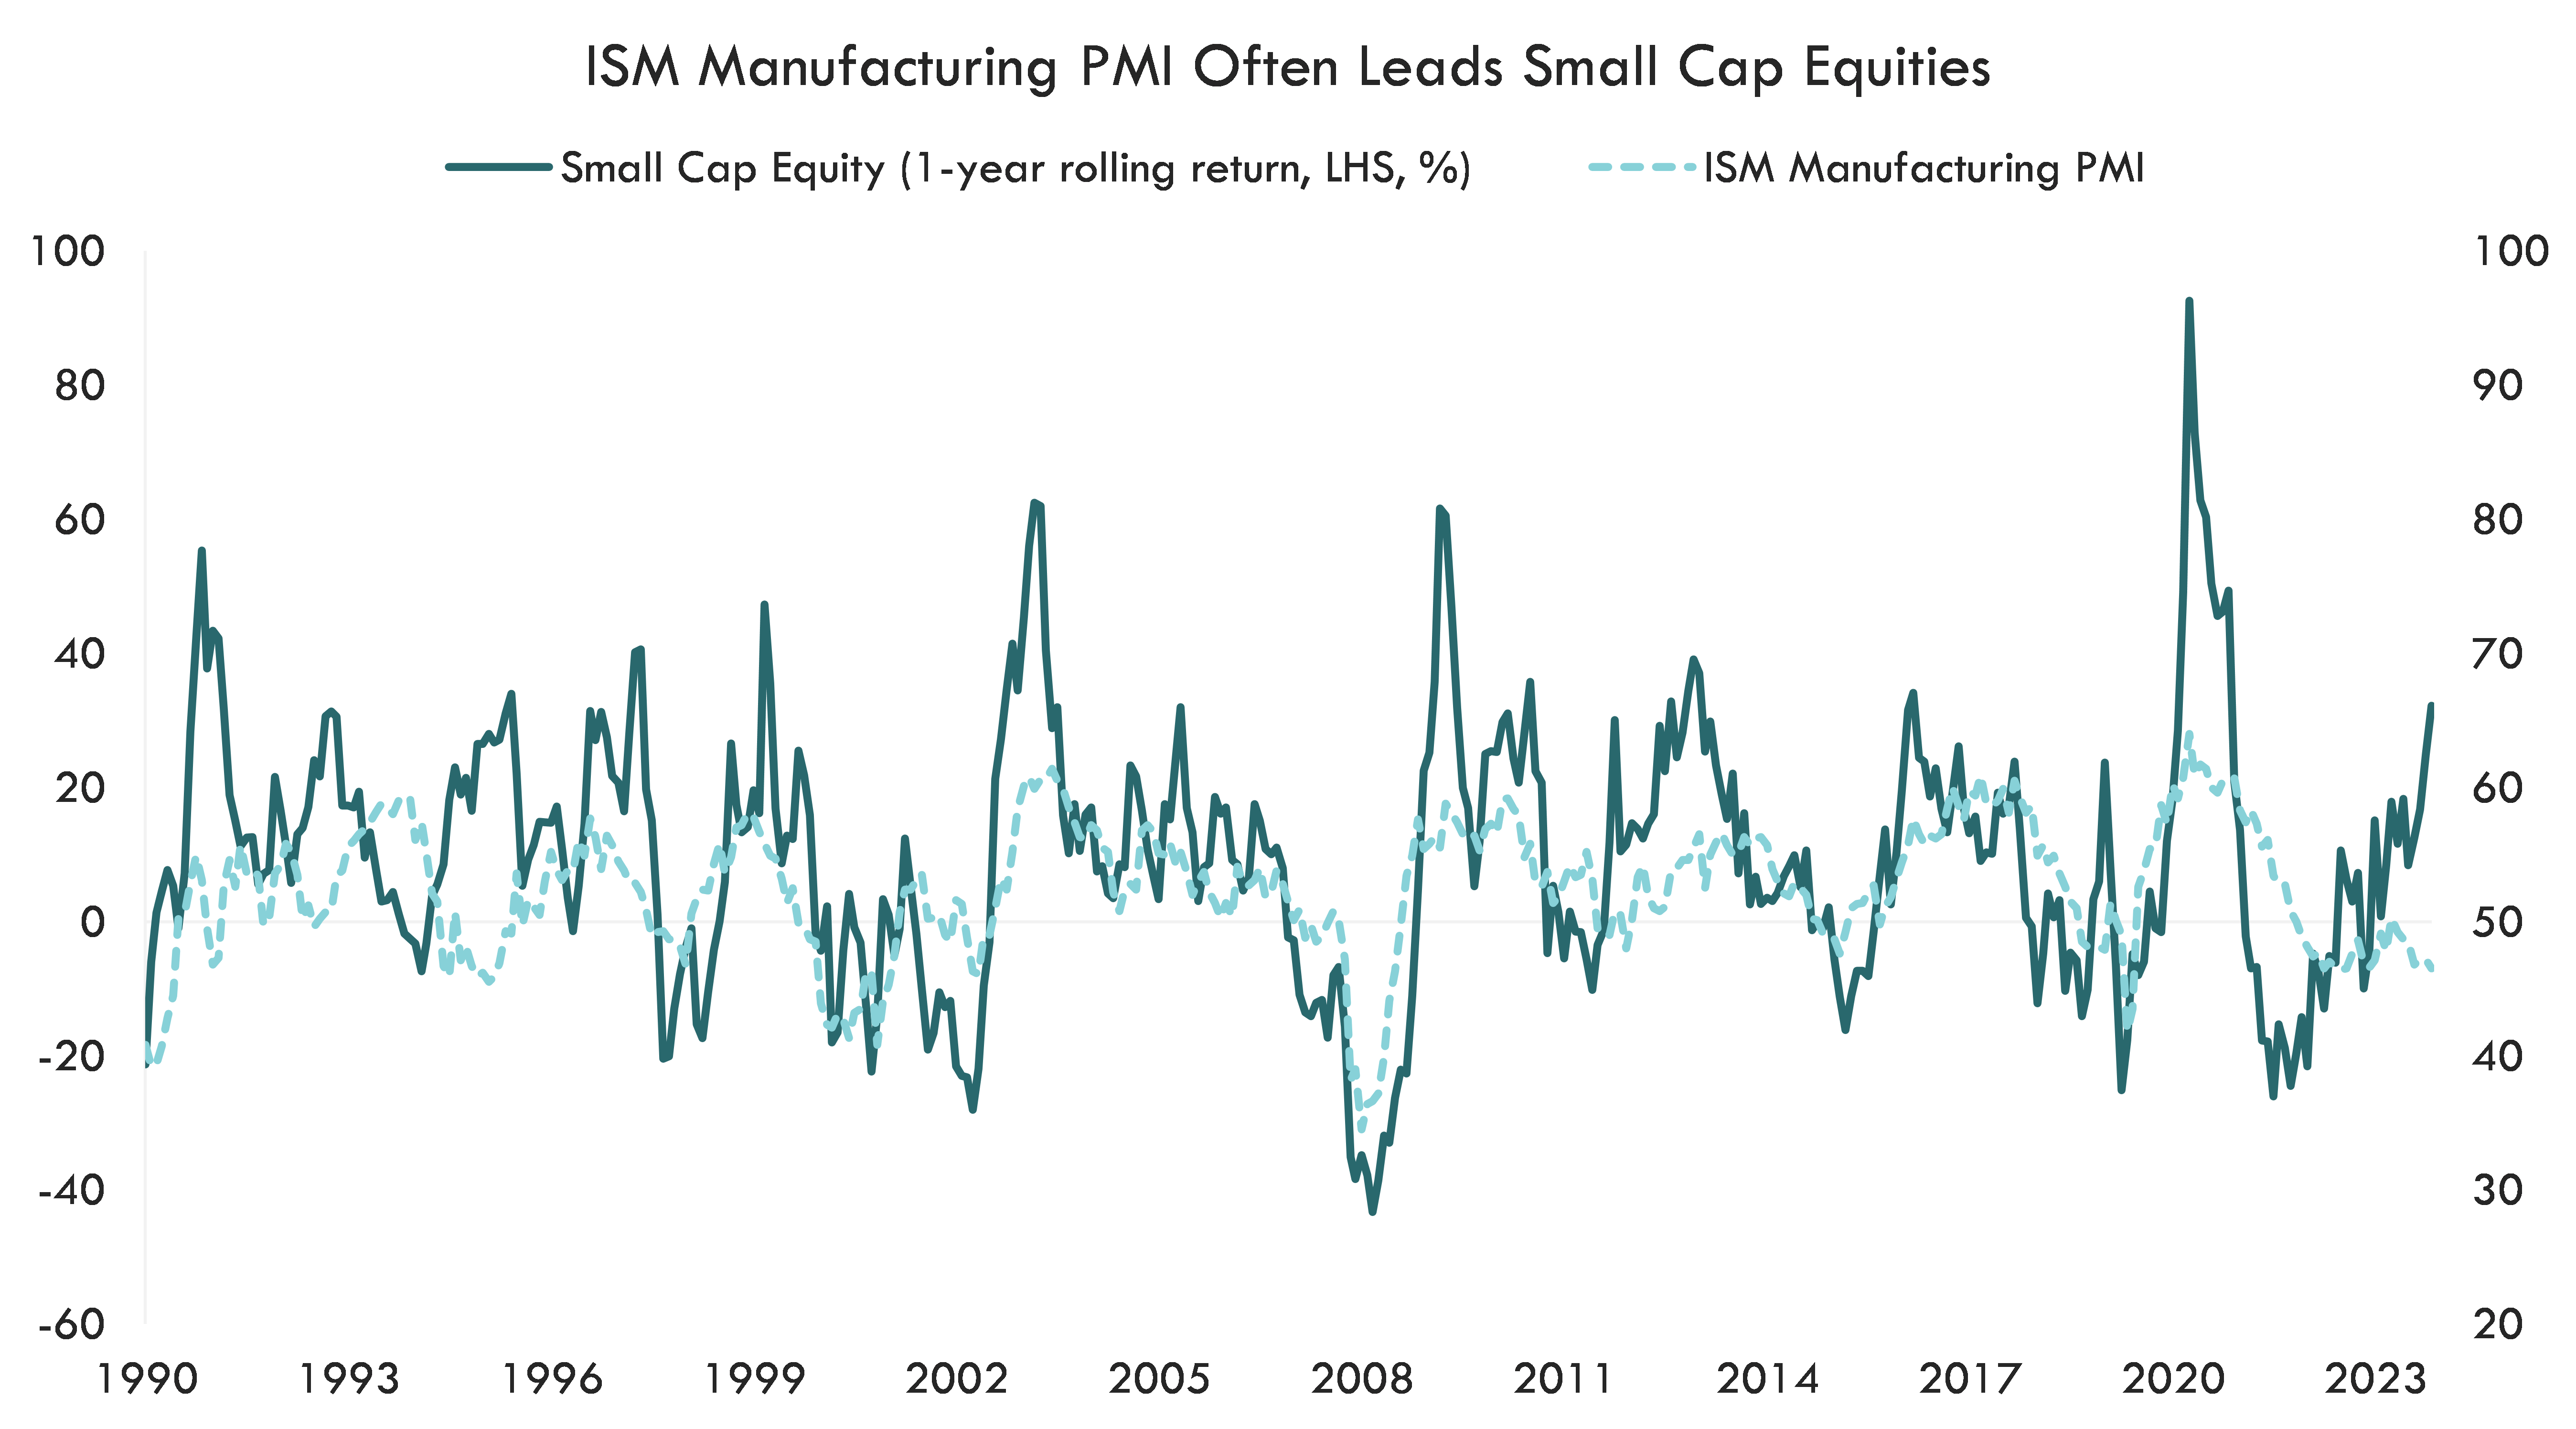
Source: Bloomberg L.P., Innovator Research & Investment Strategy. Small-cap equity returns are represented by the Russell 2000 Index. Monthly data from 12/31/1990 - 10/31/2024. Past performance is no guarantee of future results. Past performance is not indicative of future results. One cannot invest directly into an index.
What an All-Time High Could Mean
The Russell 2000 hit a record high in November 2021, trailing the ISM PMI by approximately 8 months. Following the recent post-election surge, the index is now just 1.8% shy of reaching a new all-time high. Our research indicates that once an index reaches a new high, it often goes on to do so multiple times in a single year. Since 2013, each all-time high was typically followed by at least ten additional highs in that same year, with one peak year seeing 67 more. A new high above $2,442.74 could, therefore, serve as a bullish signal for small-cap performance in the months ahead.
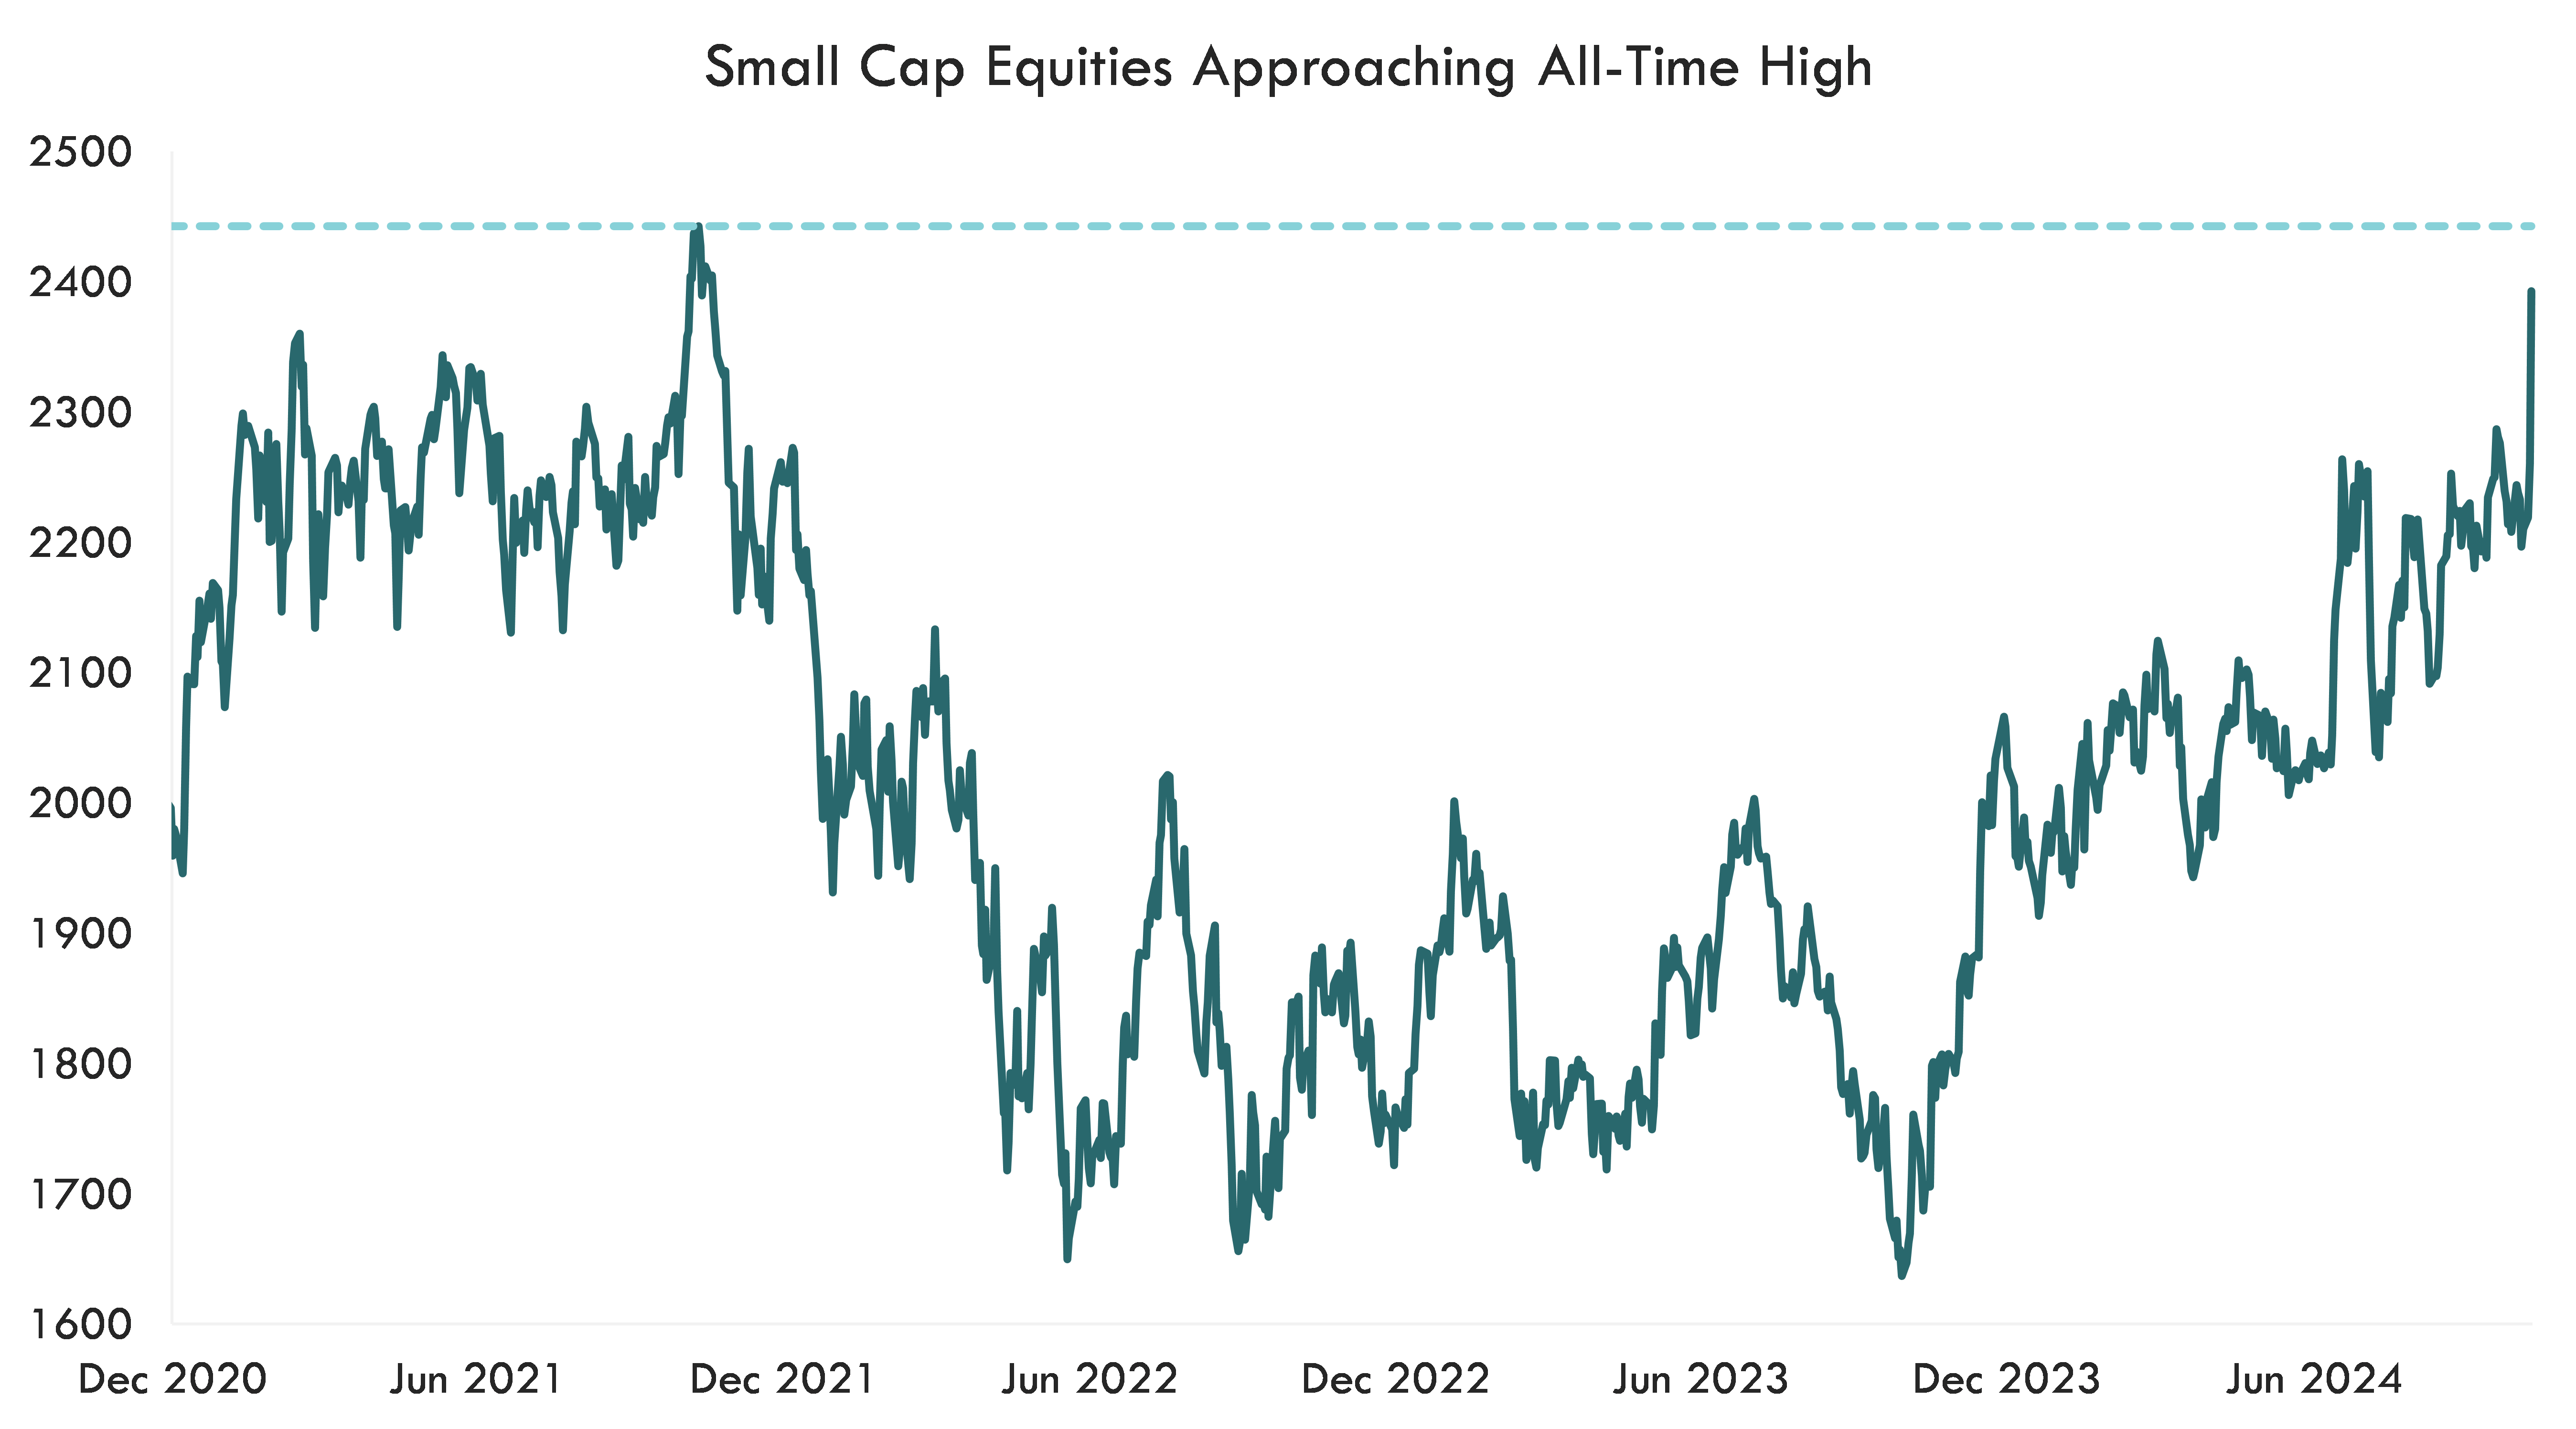
Source: Bloomberg, Innovator Research & Investment Strategy. Small-cap equity prices represented by the Russell 2000 Index. Daily price data from 12/31/2020 - 11/6/2024. Past performance is not indicative of future results. One cannot invest directly into an index.
Bottom Line
The regime change in 2016 provided a tailwind for small companies, boosting confidence in favorable tax policies and lighter regulation. This sentiment was reflected in a surge in the NFIB Small Business Optimism Index. Recently, small-caps have enjoyed short-term outperformance against large-caps after headline CPI peaked, the Fed paused its tightening cycle in 2023, as markets priced in rate cuts in 2024, and following the latest changes in Washington. However, rate cuts alone are unlikely to drive sustained small-cap outperformance. Alongside continued rate easing, I would monitor small business optimism, economic growth, and earnings trends closely prior to considering a tactical overweight in small-cap equities.
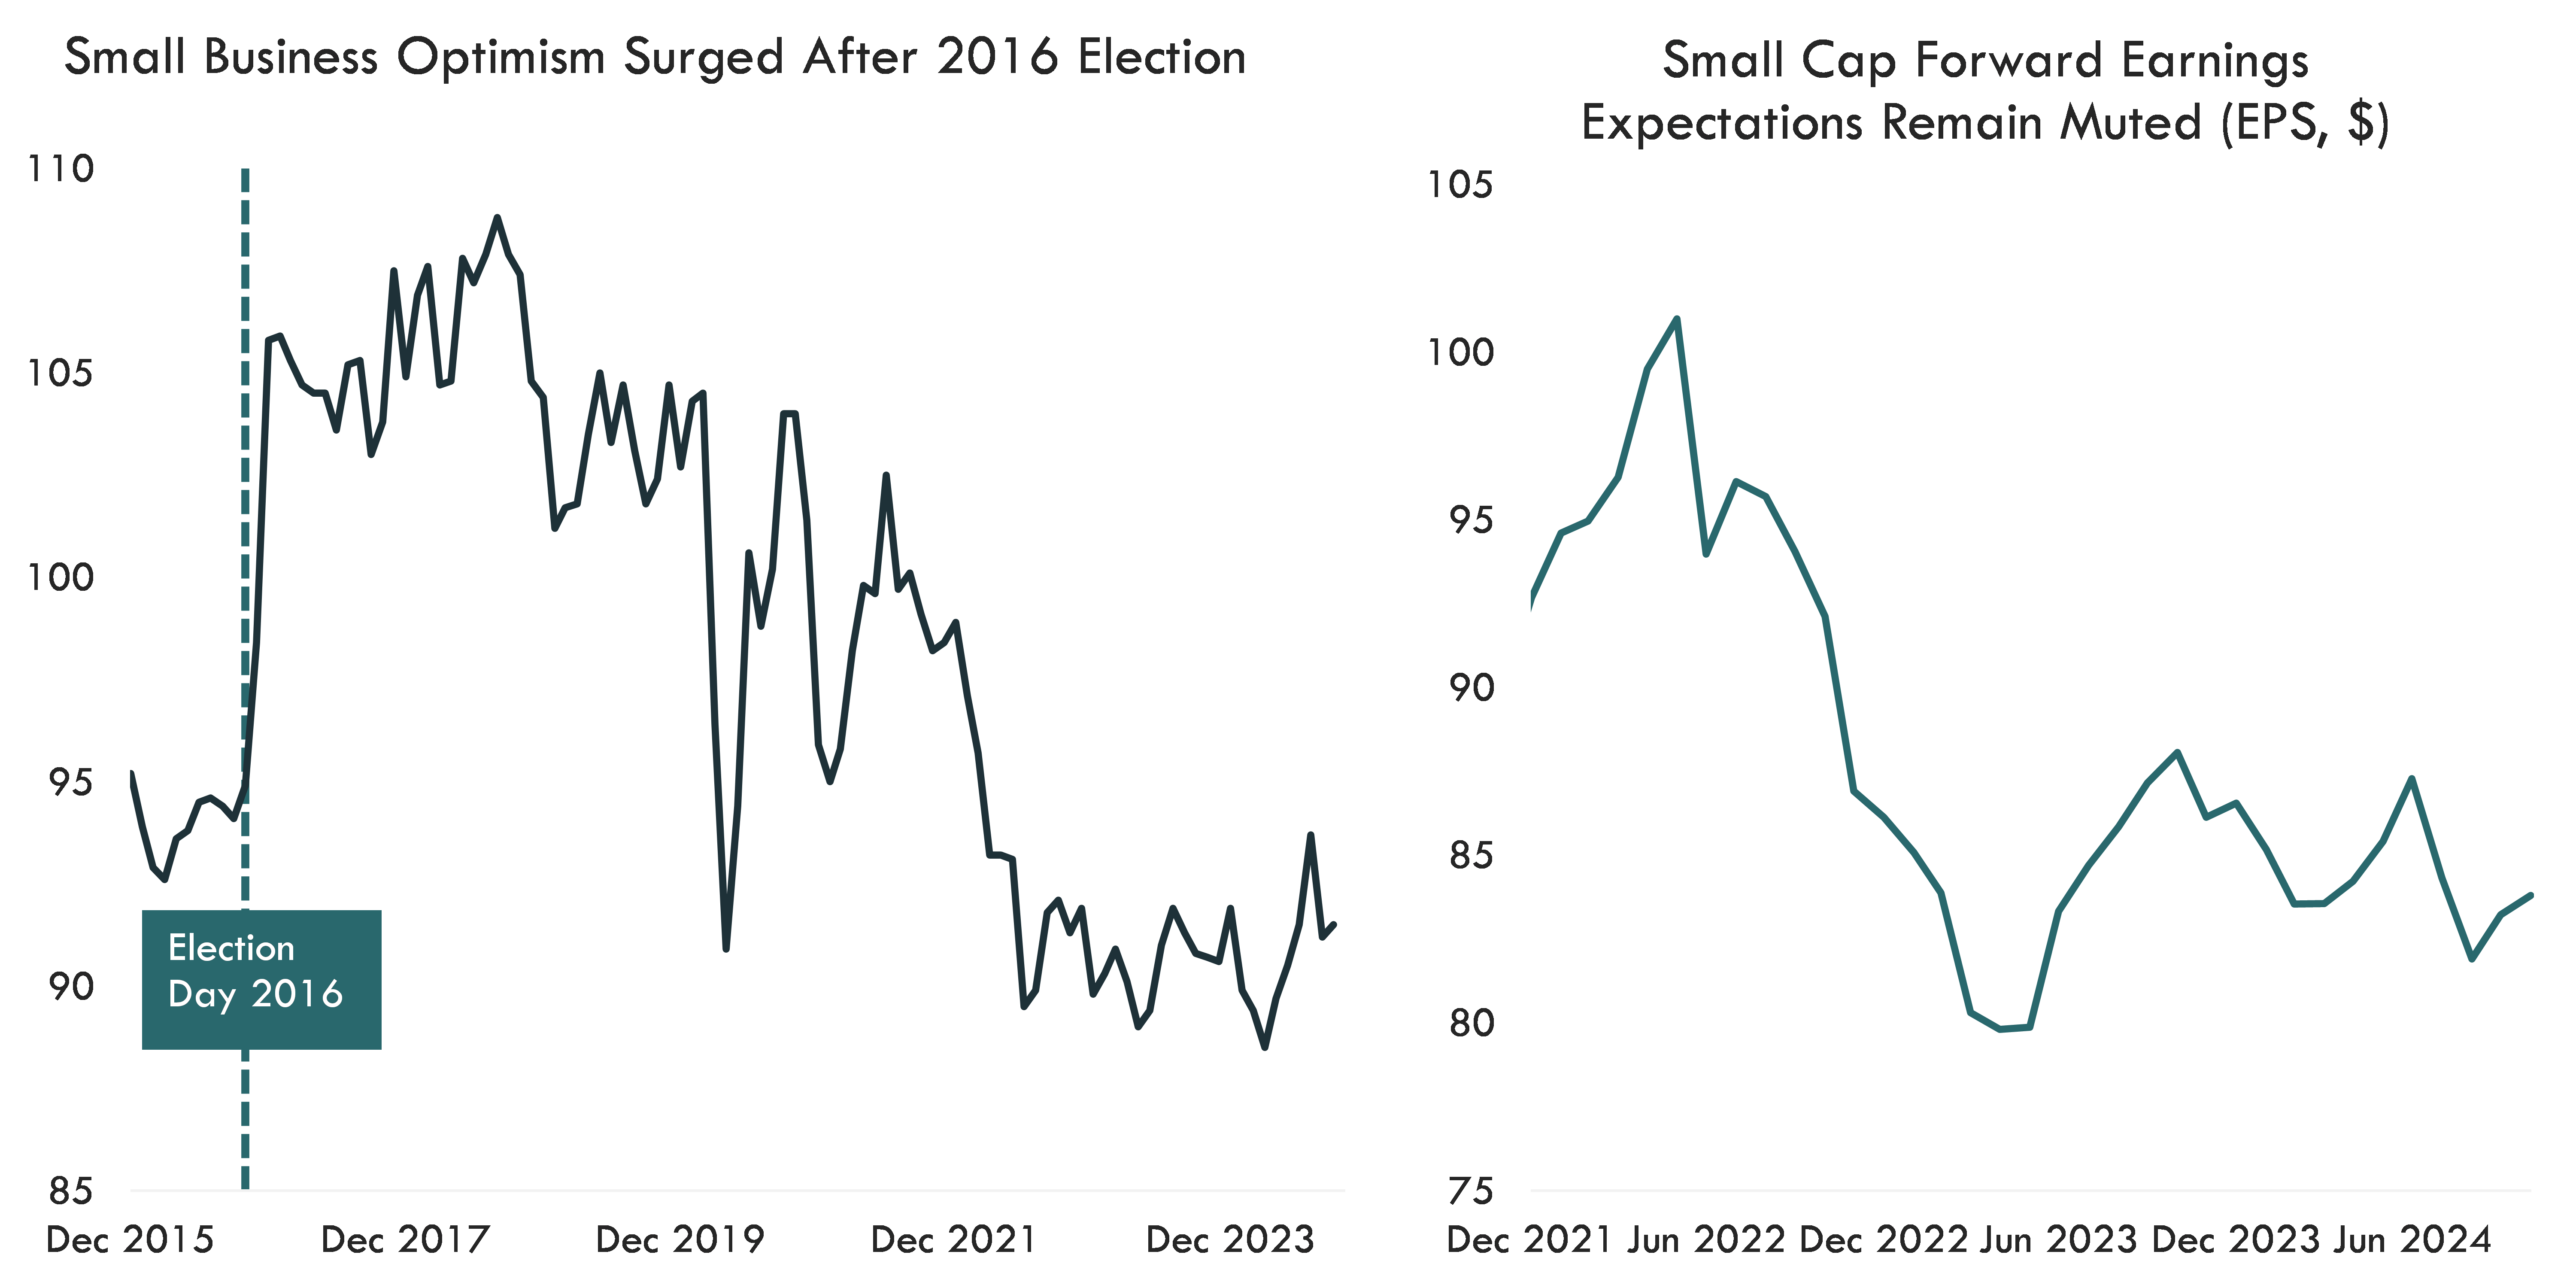
Source: Bloomberg, Innovator Research & Investment Strategy. Small Business Optimism measured by the NFIB Index. Monthly data from 12/31/2015 – 9/30/2024. Forward EPS Expectations shown for the Russell 2000 Index from 12/31/2021 – 10/31/2024.
This material contains the current research and opinions of its author, which are subject to change without notice. This material is not a recommendation to participate in any particular trading strategy and does not constitute an offer or solicitation to purchase any investment product. Unless expressly stated to the contrary, the opinions, interpretations, and findings herein do not necessarily represent the views of Innovator Capital Management, LLC (“Innovator”) or any of its affiliates.
This material is provided for informational purposes only. References to specific securities in this material are provided for informational purposes only and do not constitute a recommendation for any security. Readers should consult with their investment and tax advisers to obtain investment advice and should not rely upon information published by Innovator or any of its affiliates. Past performance does not guarantee future results. The information herein represents an evaluation of market conditions as of the date of publishing, is subject to change, and is not intended to be a forecast of investment outcomes.
Certain information herein contains forward-looking statements such as "will," "may," "should," "expect," "target," "anticipate," or other variations of these statements. Forward-looking statements are based upon assumptions which may not occur, while other conditions not taken into account may occur. Actual events or results may differ materially from those contemplated in such forward-looking statements.