July 1, 2023
The Case for Buffer Equities as a Strategic Holding
Tom O'Shea, CFA
Director of Investment Strategy
Innovator Capital Management
Risk management is vital to any investment strategy. Investors must consider their ability and willingness to take risk, return expectations, and the time horizon of specific investment goals before constructing portfolios. Diversification has been the primary tool for risk management by which portfolio managers allocate to uncorrelated asset classes. The idea is that by spreading out investors’ dollars across many assets over a long period of time, some asset classes will maintain value or appreciate, offsetting losses from others that decline.
In reality, short term periods of financial market distress can lead to rising asset correlations that leave market participants with less protection than expected. Investors experienced these rising correlations most recently with the bear market beginning in 2022, as well periods in and around the bear markets illustrated below. The bear market beginning in 2022 lead to U.S. equities and investment-grade bonds simultaneously falling double digits to -18.1% and -13%, respectively. A 15% U.S. equity buffer strategy would have only fallen about -3.1% for a one-year outcome period beginning in January 2022.
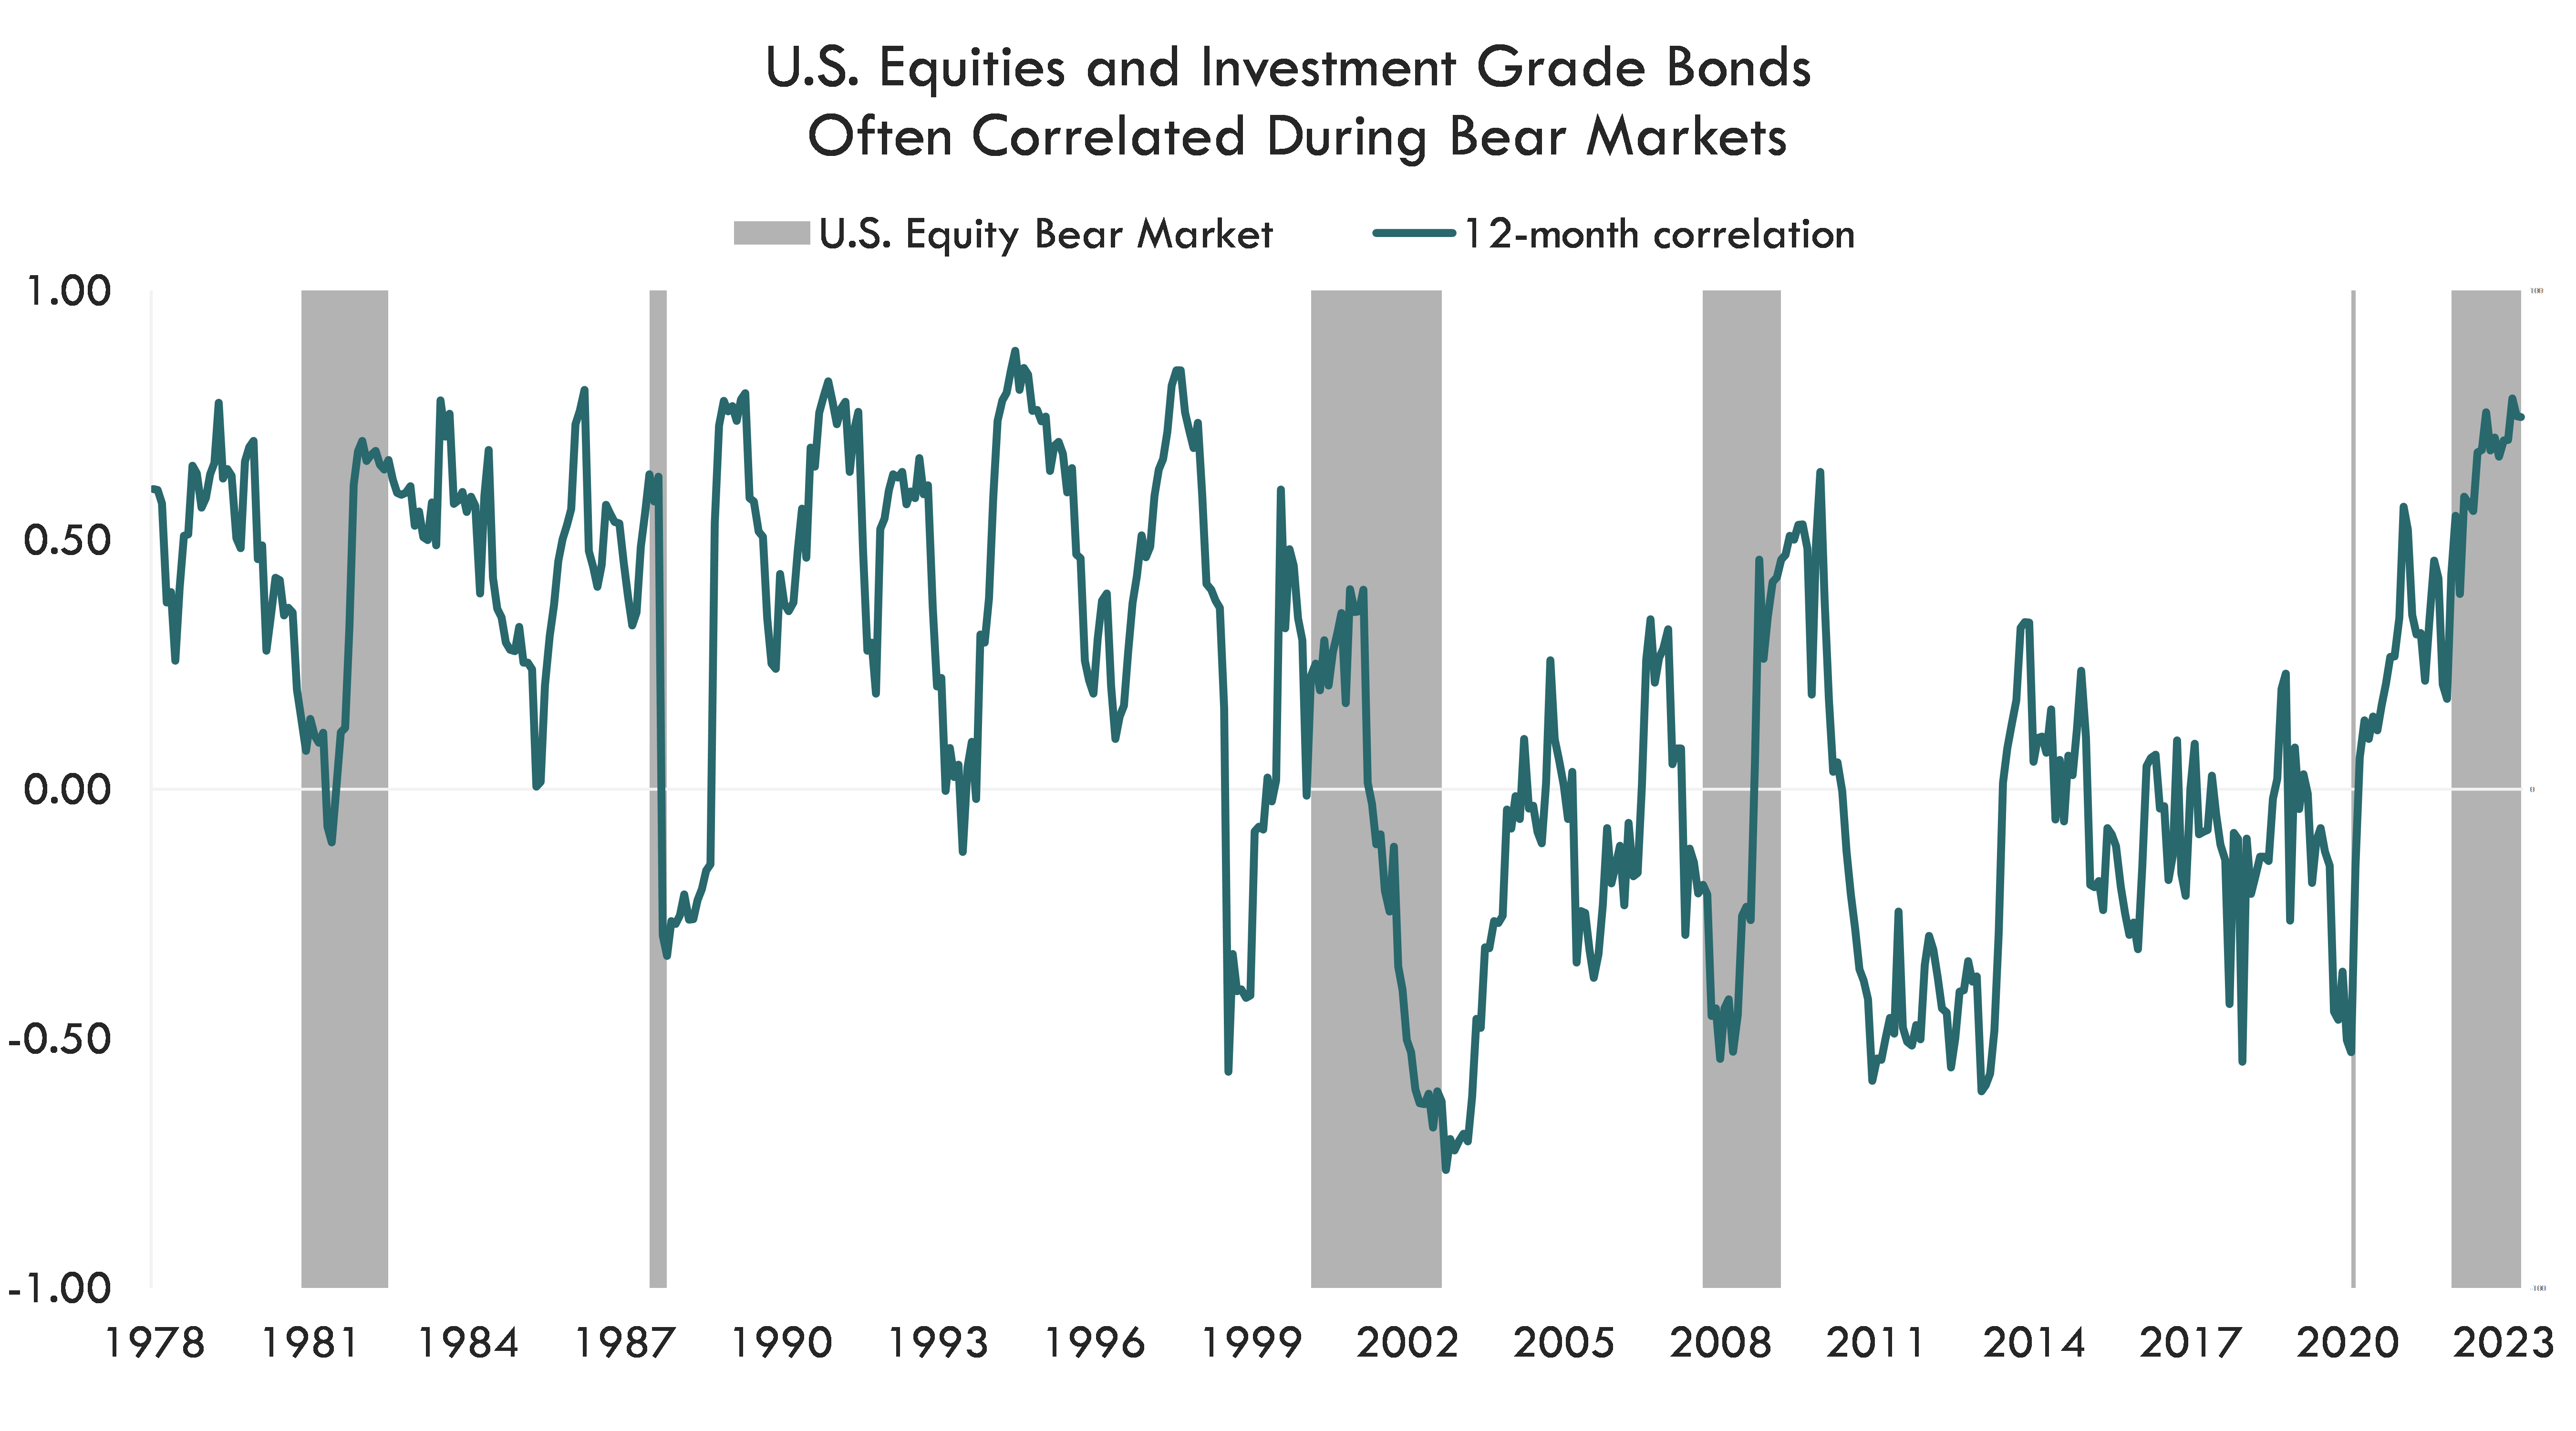
Source: Bloomberg, Innovator Research & Investment Strategy. U.S equities = S&P 500. Investment Grade Bonds = Bloomberg U.S. Aggregate Bond index. Correlation is a statistical measure of the strength of a linear relationship between two asset returns.
Why Buffer Equities? Avoid Market Timing
Since World War II, there have been 13 bear markets, occurring every 4.7 years on median. An additional 30 corrections greater than 10% have occurred during bull market runs. Nimbly shifting to cash prior to these large drawdowns would add huge value, but timing is much easier said than done. When attempting to time the market, there are a few typical mistakes investors often make: 1) Failing to exit positions before the drawdown begins 2) Exiting positions well before the peak 3) Re-entering the market too far after the trough.
Using 2022 as an example, investor concerns about recession didn’t peak until the week of June 12. By that point in the year, the S&P 500 had already declined 15.5%. Exiting at that peak would’ve caused investors to miss the run up in the summer and possibly the 4th quarter of equity gains.
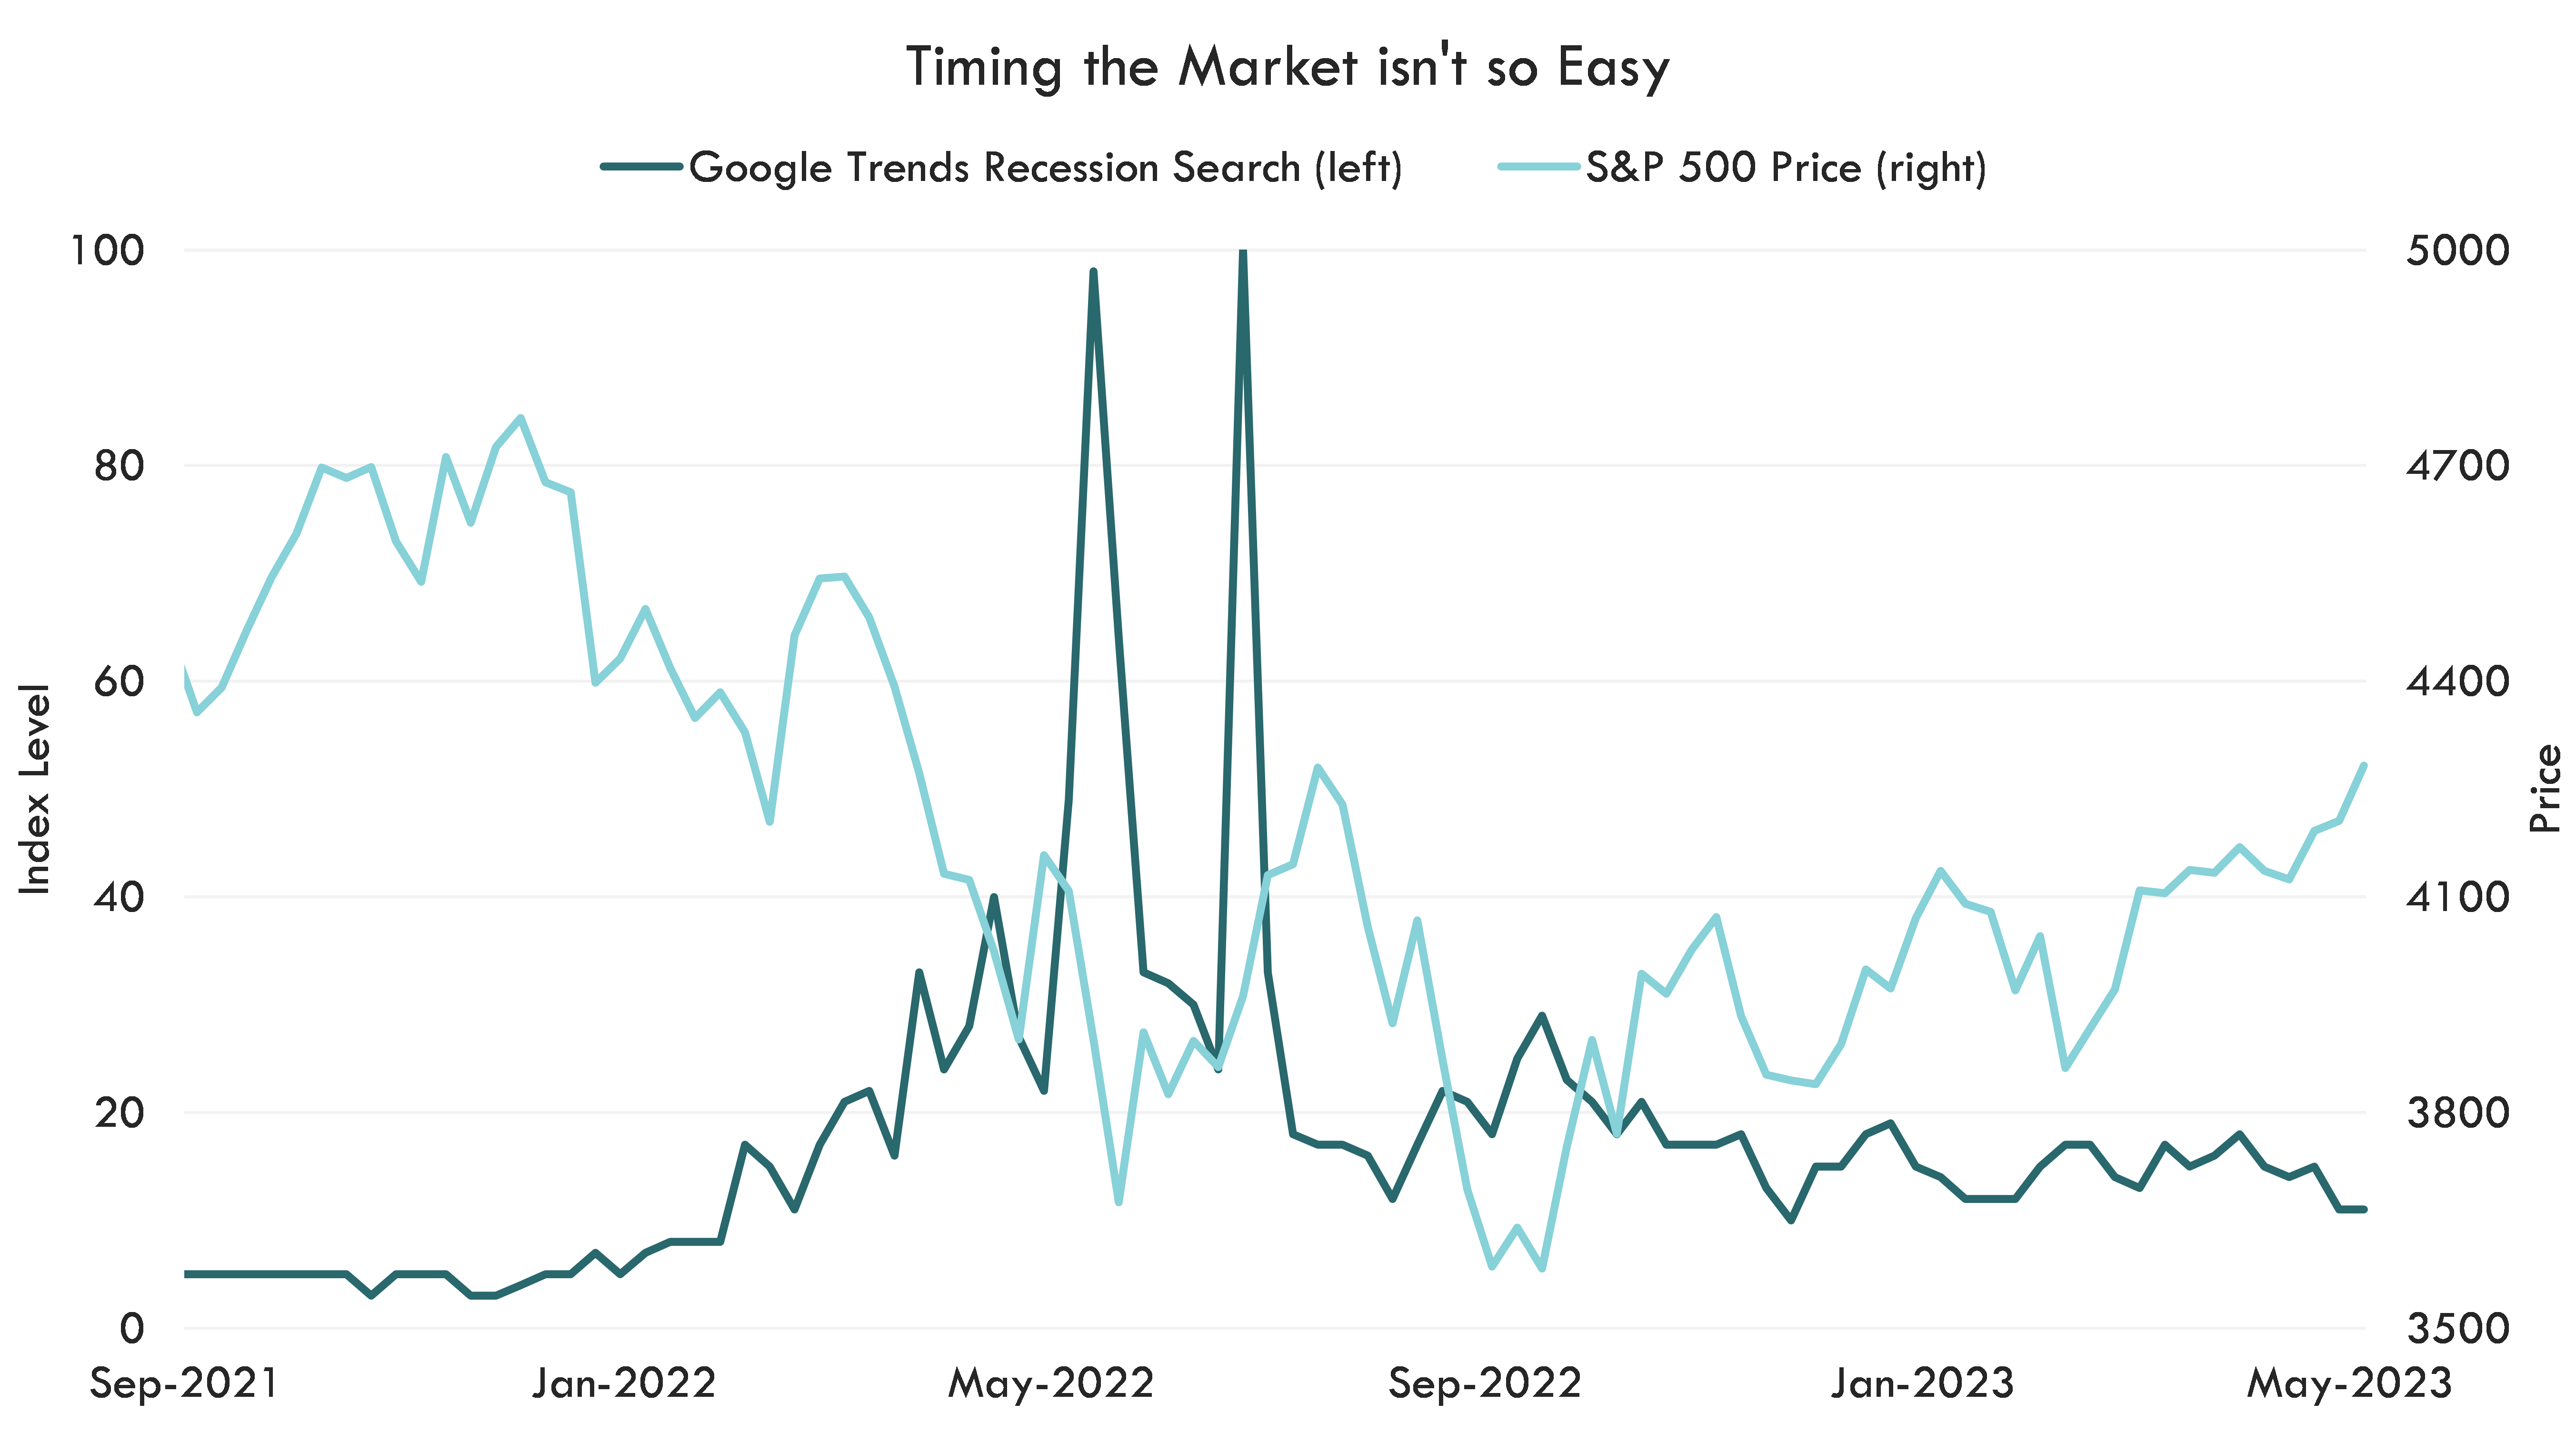
Source: Bloomberg, S&P, Google, Innovator Research & Investment Strategy. Weekly data from 9/30/2021 - 6/4/2023.
Why Buffer Equities? Minimize Drawdowns, Maintain Liquidity
Given the near-impossible challenge of timing the market, we recommend risk-aware investors focus on strategies that allow for upside participation with built-in downside protection. Attempting to time the market by remaining in risky assets may not create issues for those with a longer time horizon. But for investors with a short time horizon or liquidity needs, failing to allocate assets at the commensurate risk level may prevent one from reaching their investment goals.
Saving for a home, starting a business, or paying for children’s tuition are all examples of events requiring liquidity. In the event of a market drawdown, investors may have to sell securities at a loss, or at least at a price that is insufficient to meet their investment goal. On average, it has taken almost a year and a half for the U.S. equity market to return to its original levels after a bear market drawdown; the larger the drawdown, the longer the recovery may take because a larger return is required to breakeven.
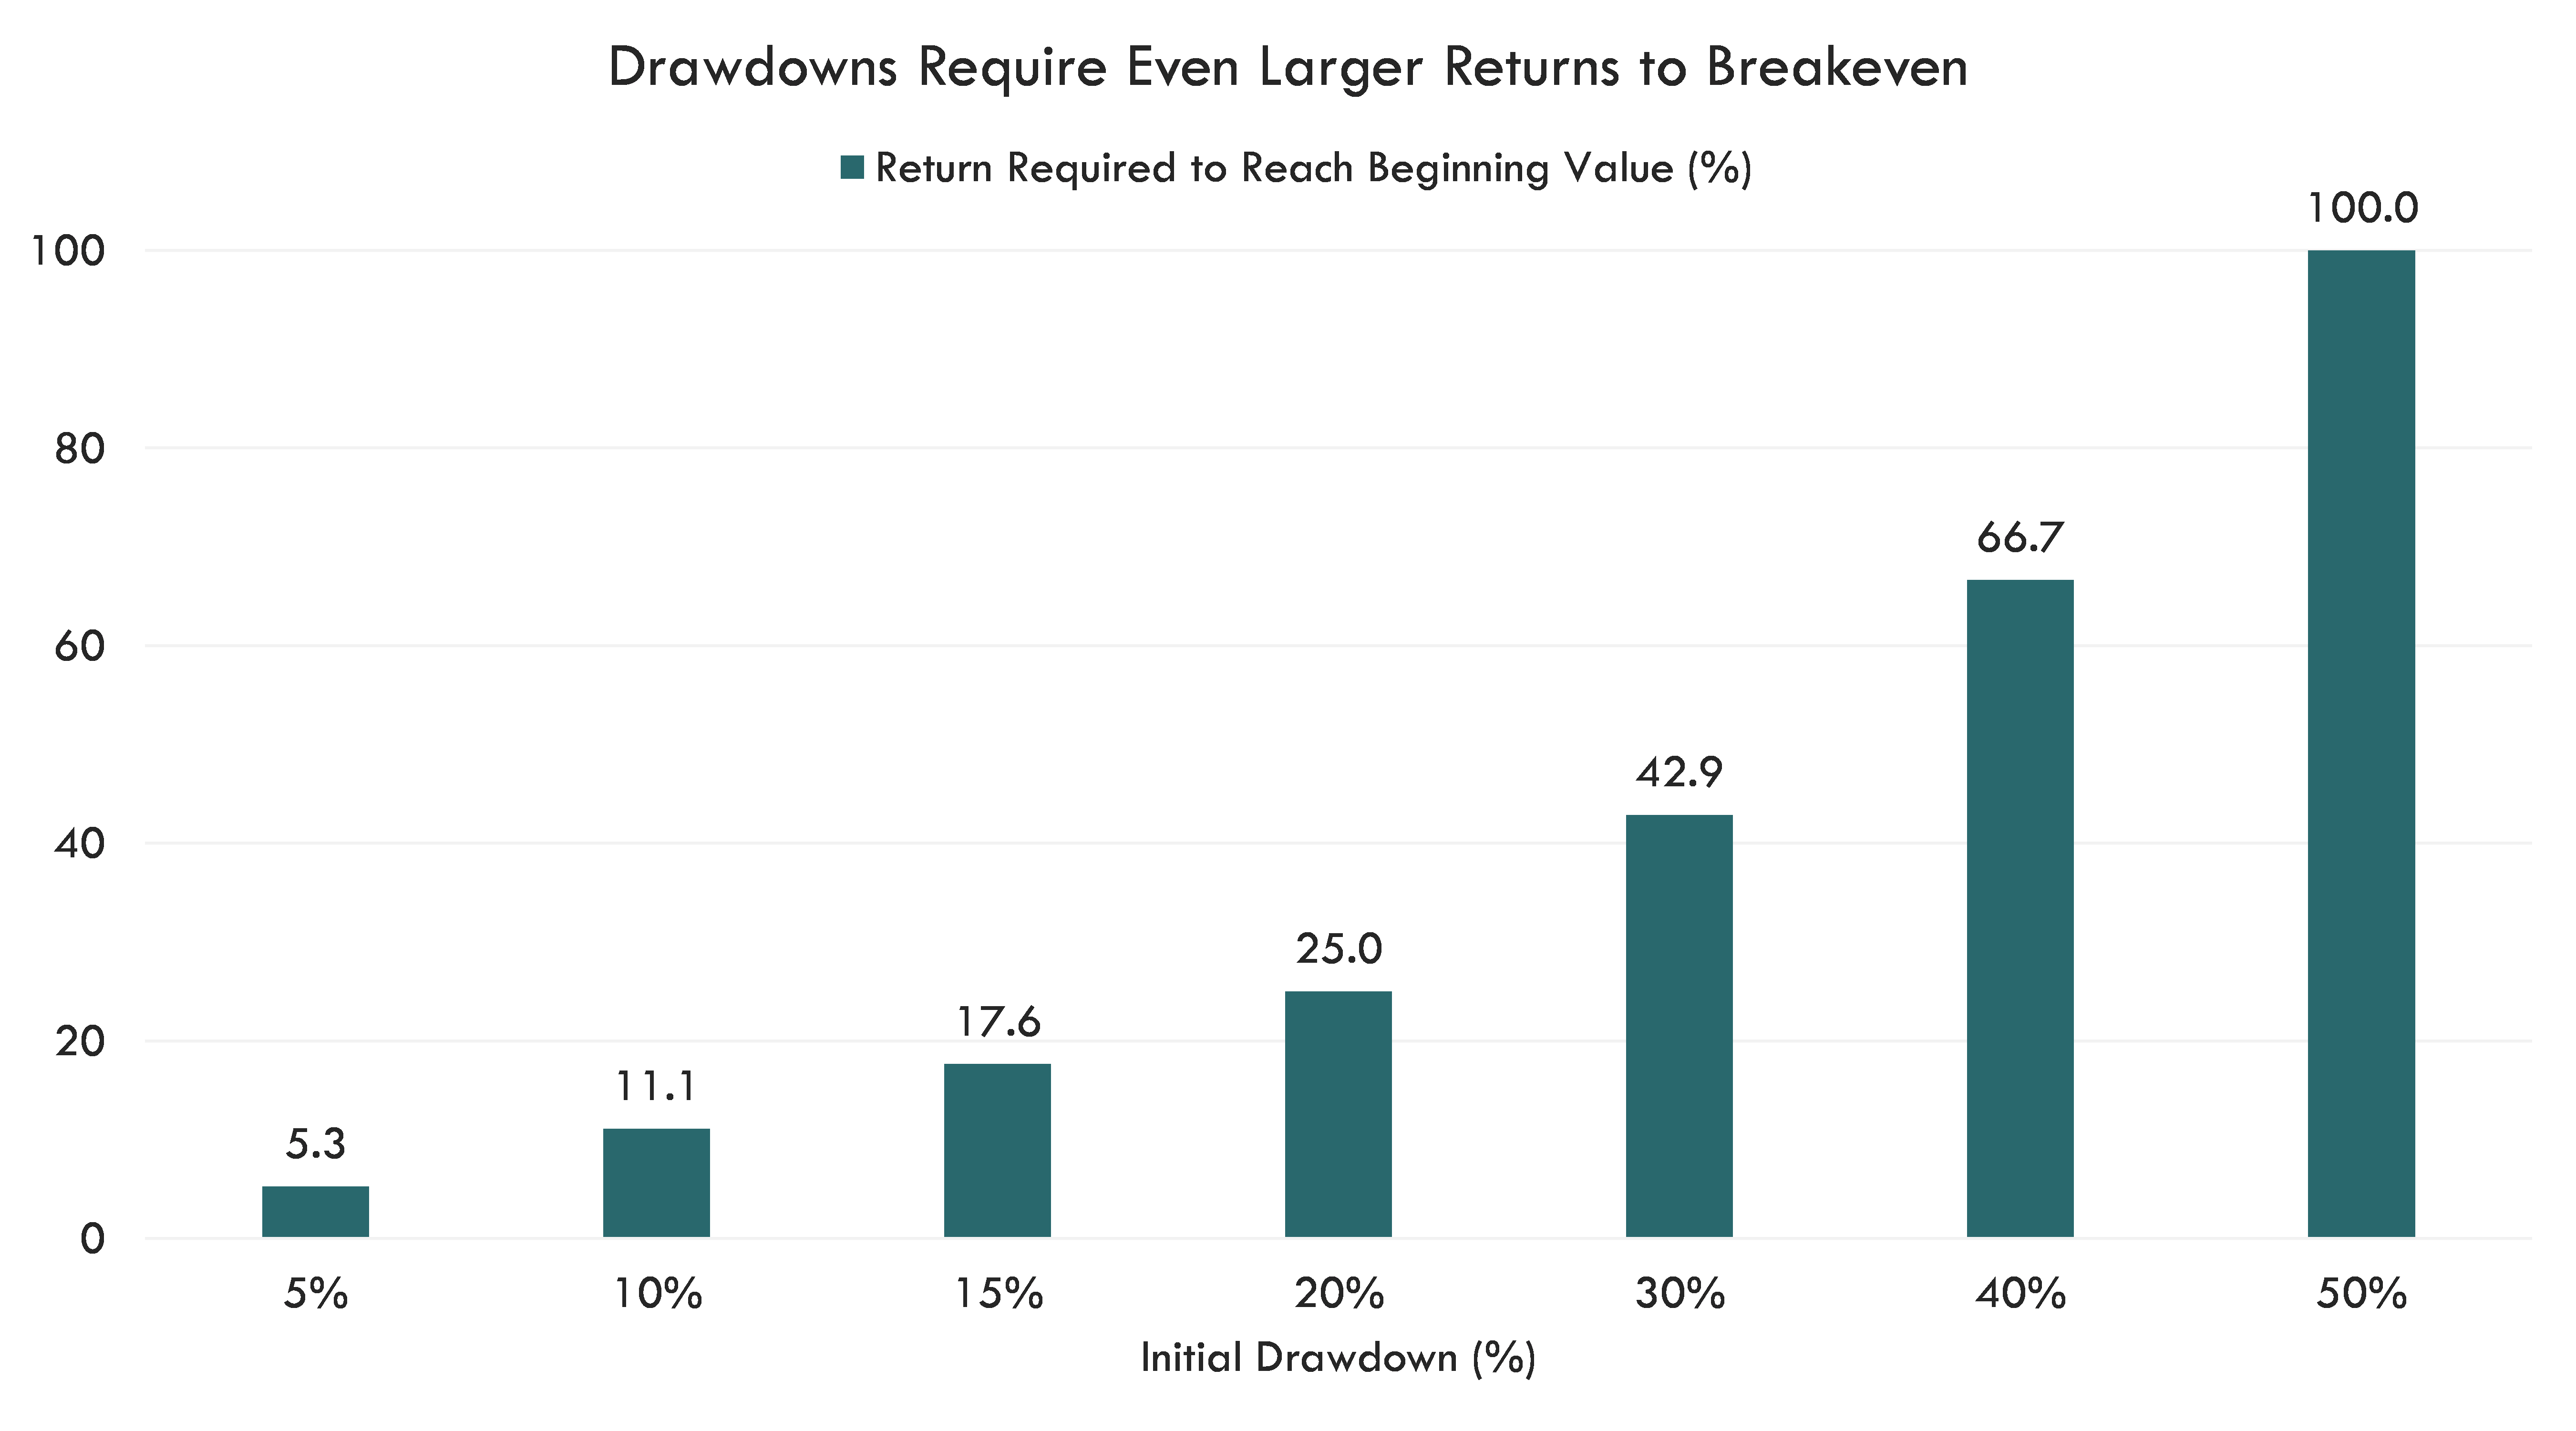
Source: Innovator Research & Investment Strategy.
Longer Time Horizon Investor: To buffer or not to buffer?
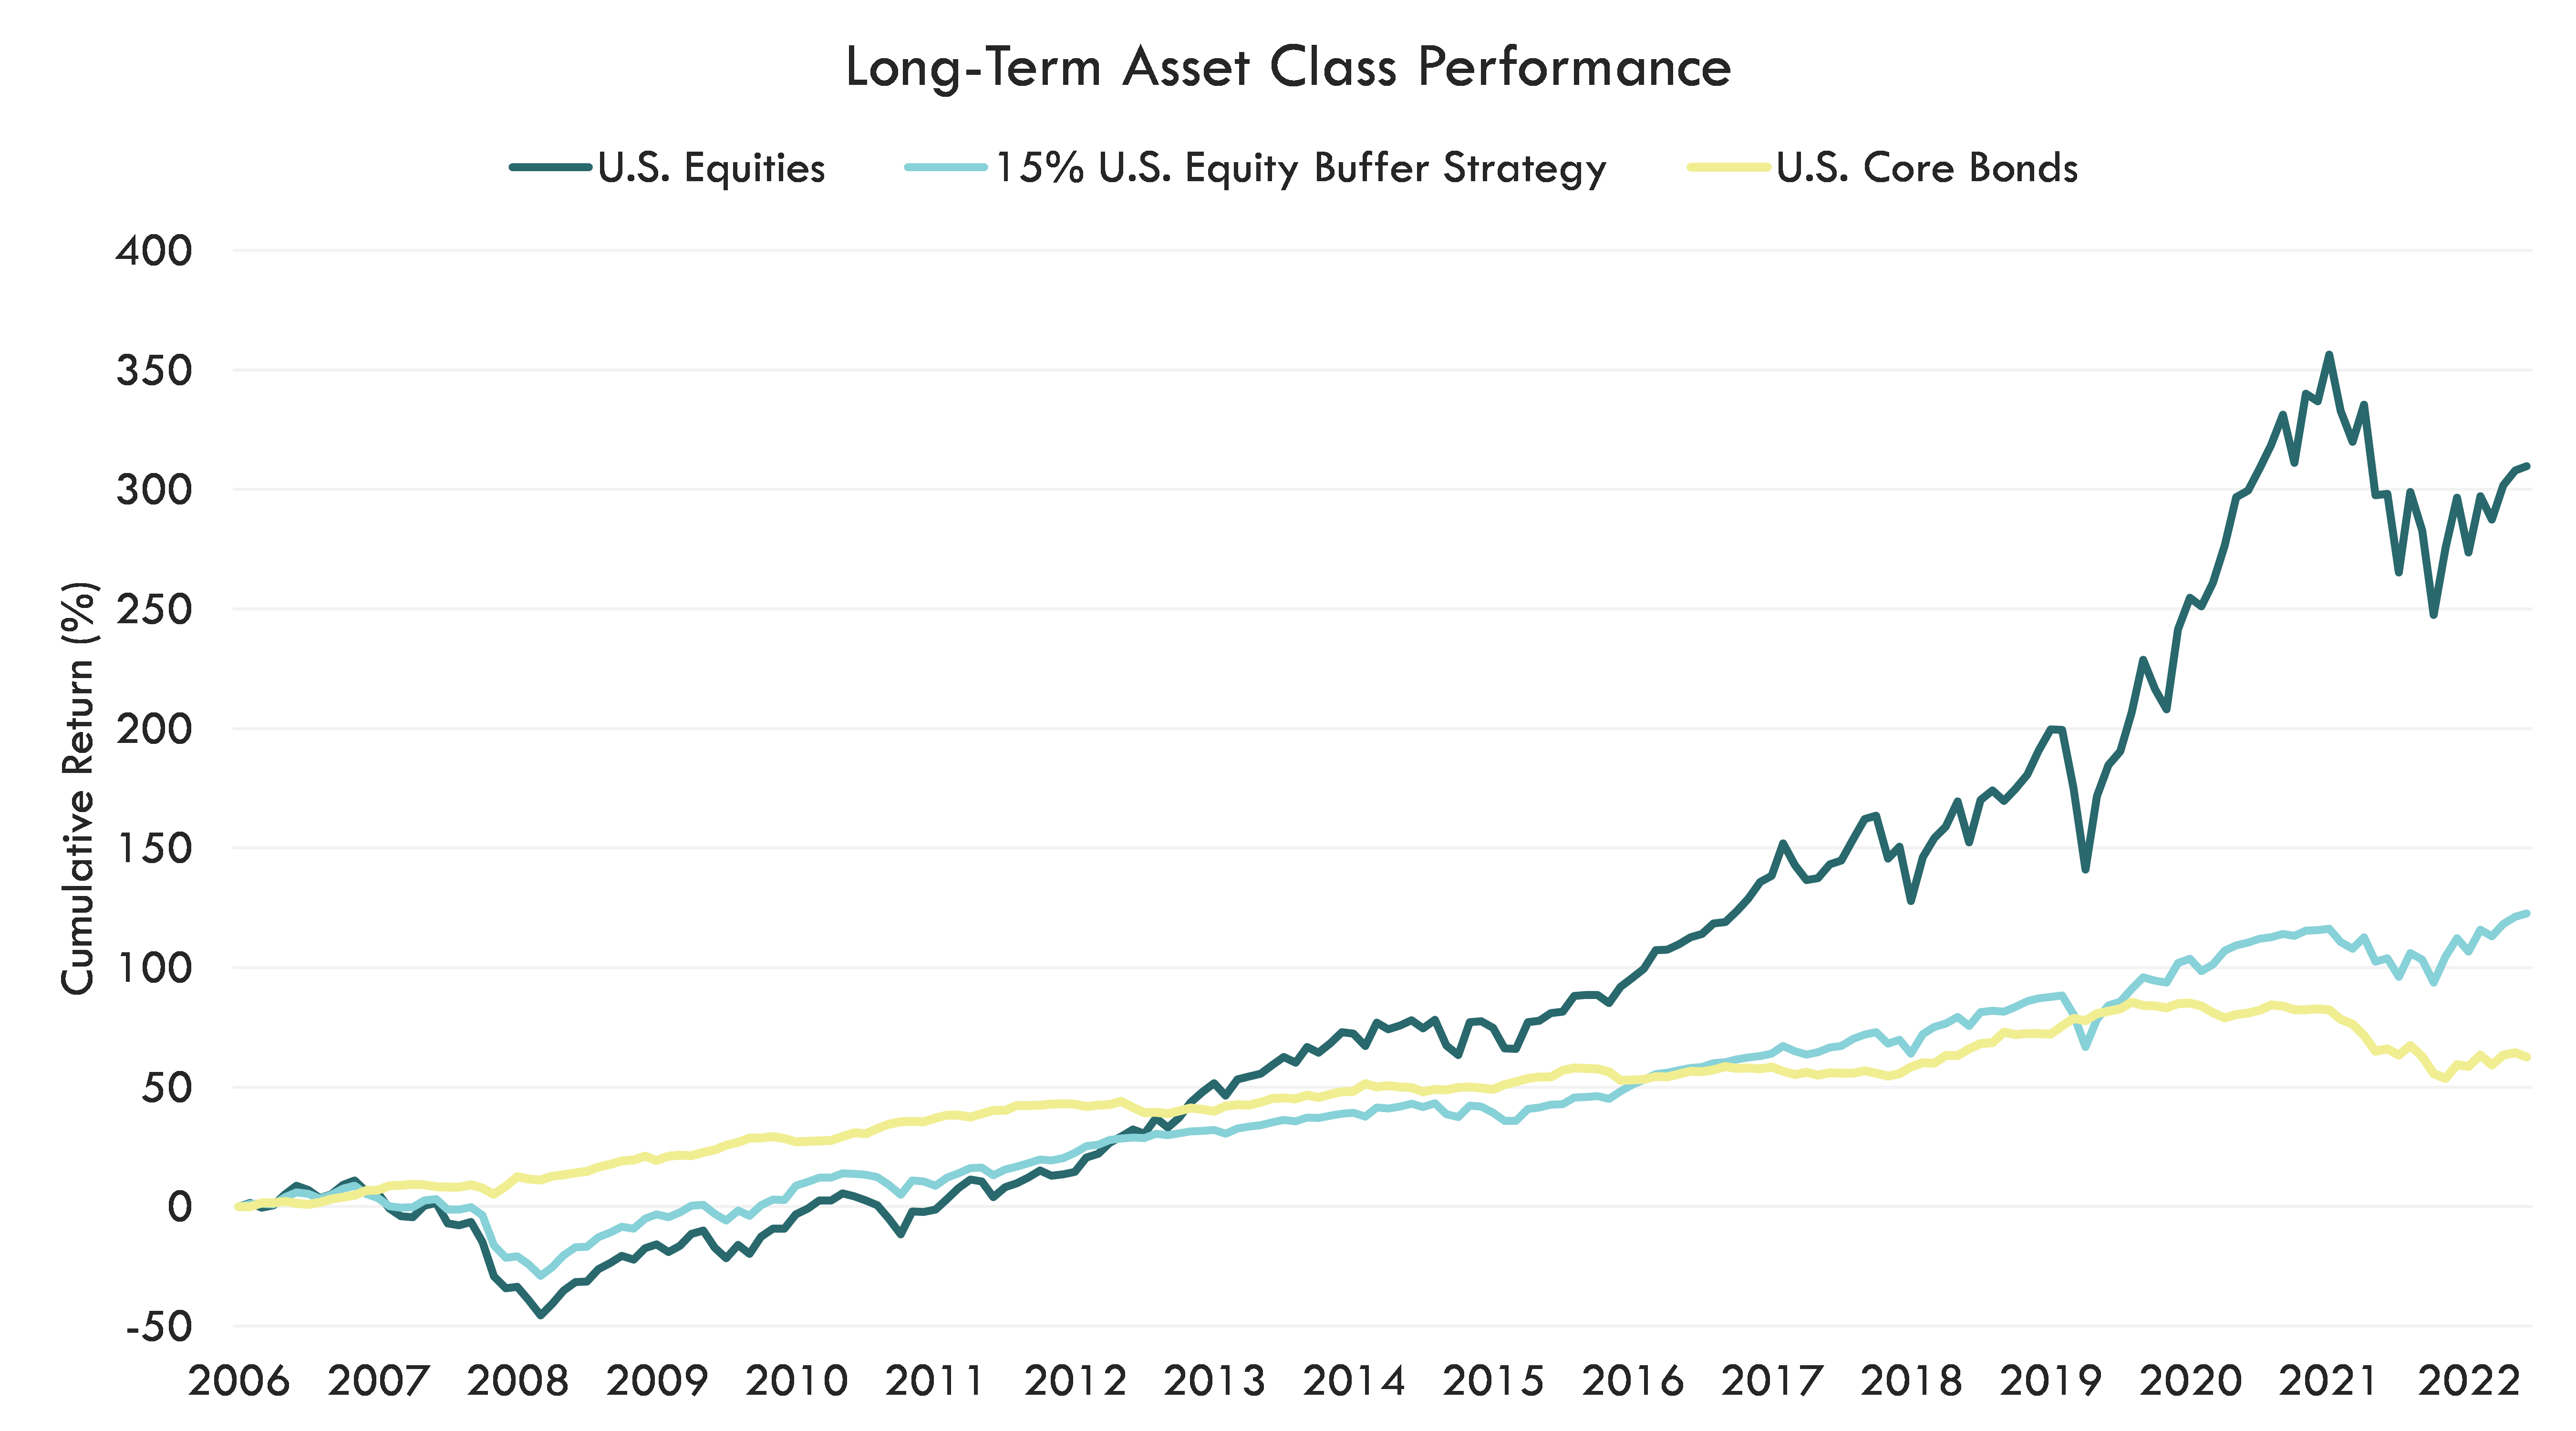
An investor’s ability to take risk does not necessarily equate a willingness to. Buffer strategies seek known levels of downside protection, allowing investors to adjust risk accordingly. As discussed previously, diversification in traditional asset classes can fail in precisely the circumstances it was meant to protect against. Even low-volatility quantitative strategies designed to minimize large drawdowns have failed in instances when investors needed them the most. For example, the S&P 500 Low Volatility Index dropped 35.6% during the Covid-19 drawdown while the S&P 500 fell 33.8%. Buffer strategies’ known levels of downside risk management can reduce volatility for those investors who are unwilling to take higher risks. When considering other asset classes, many investors want to make sure they are being compensated for the risks they are taking. Historically, the 15% U.S. buffer strategy has achieved a similar annualized return per unit of risk as the Low Volatility Index, while smoothing out the higher volatility cycles as seen below.
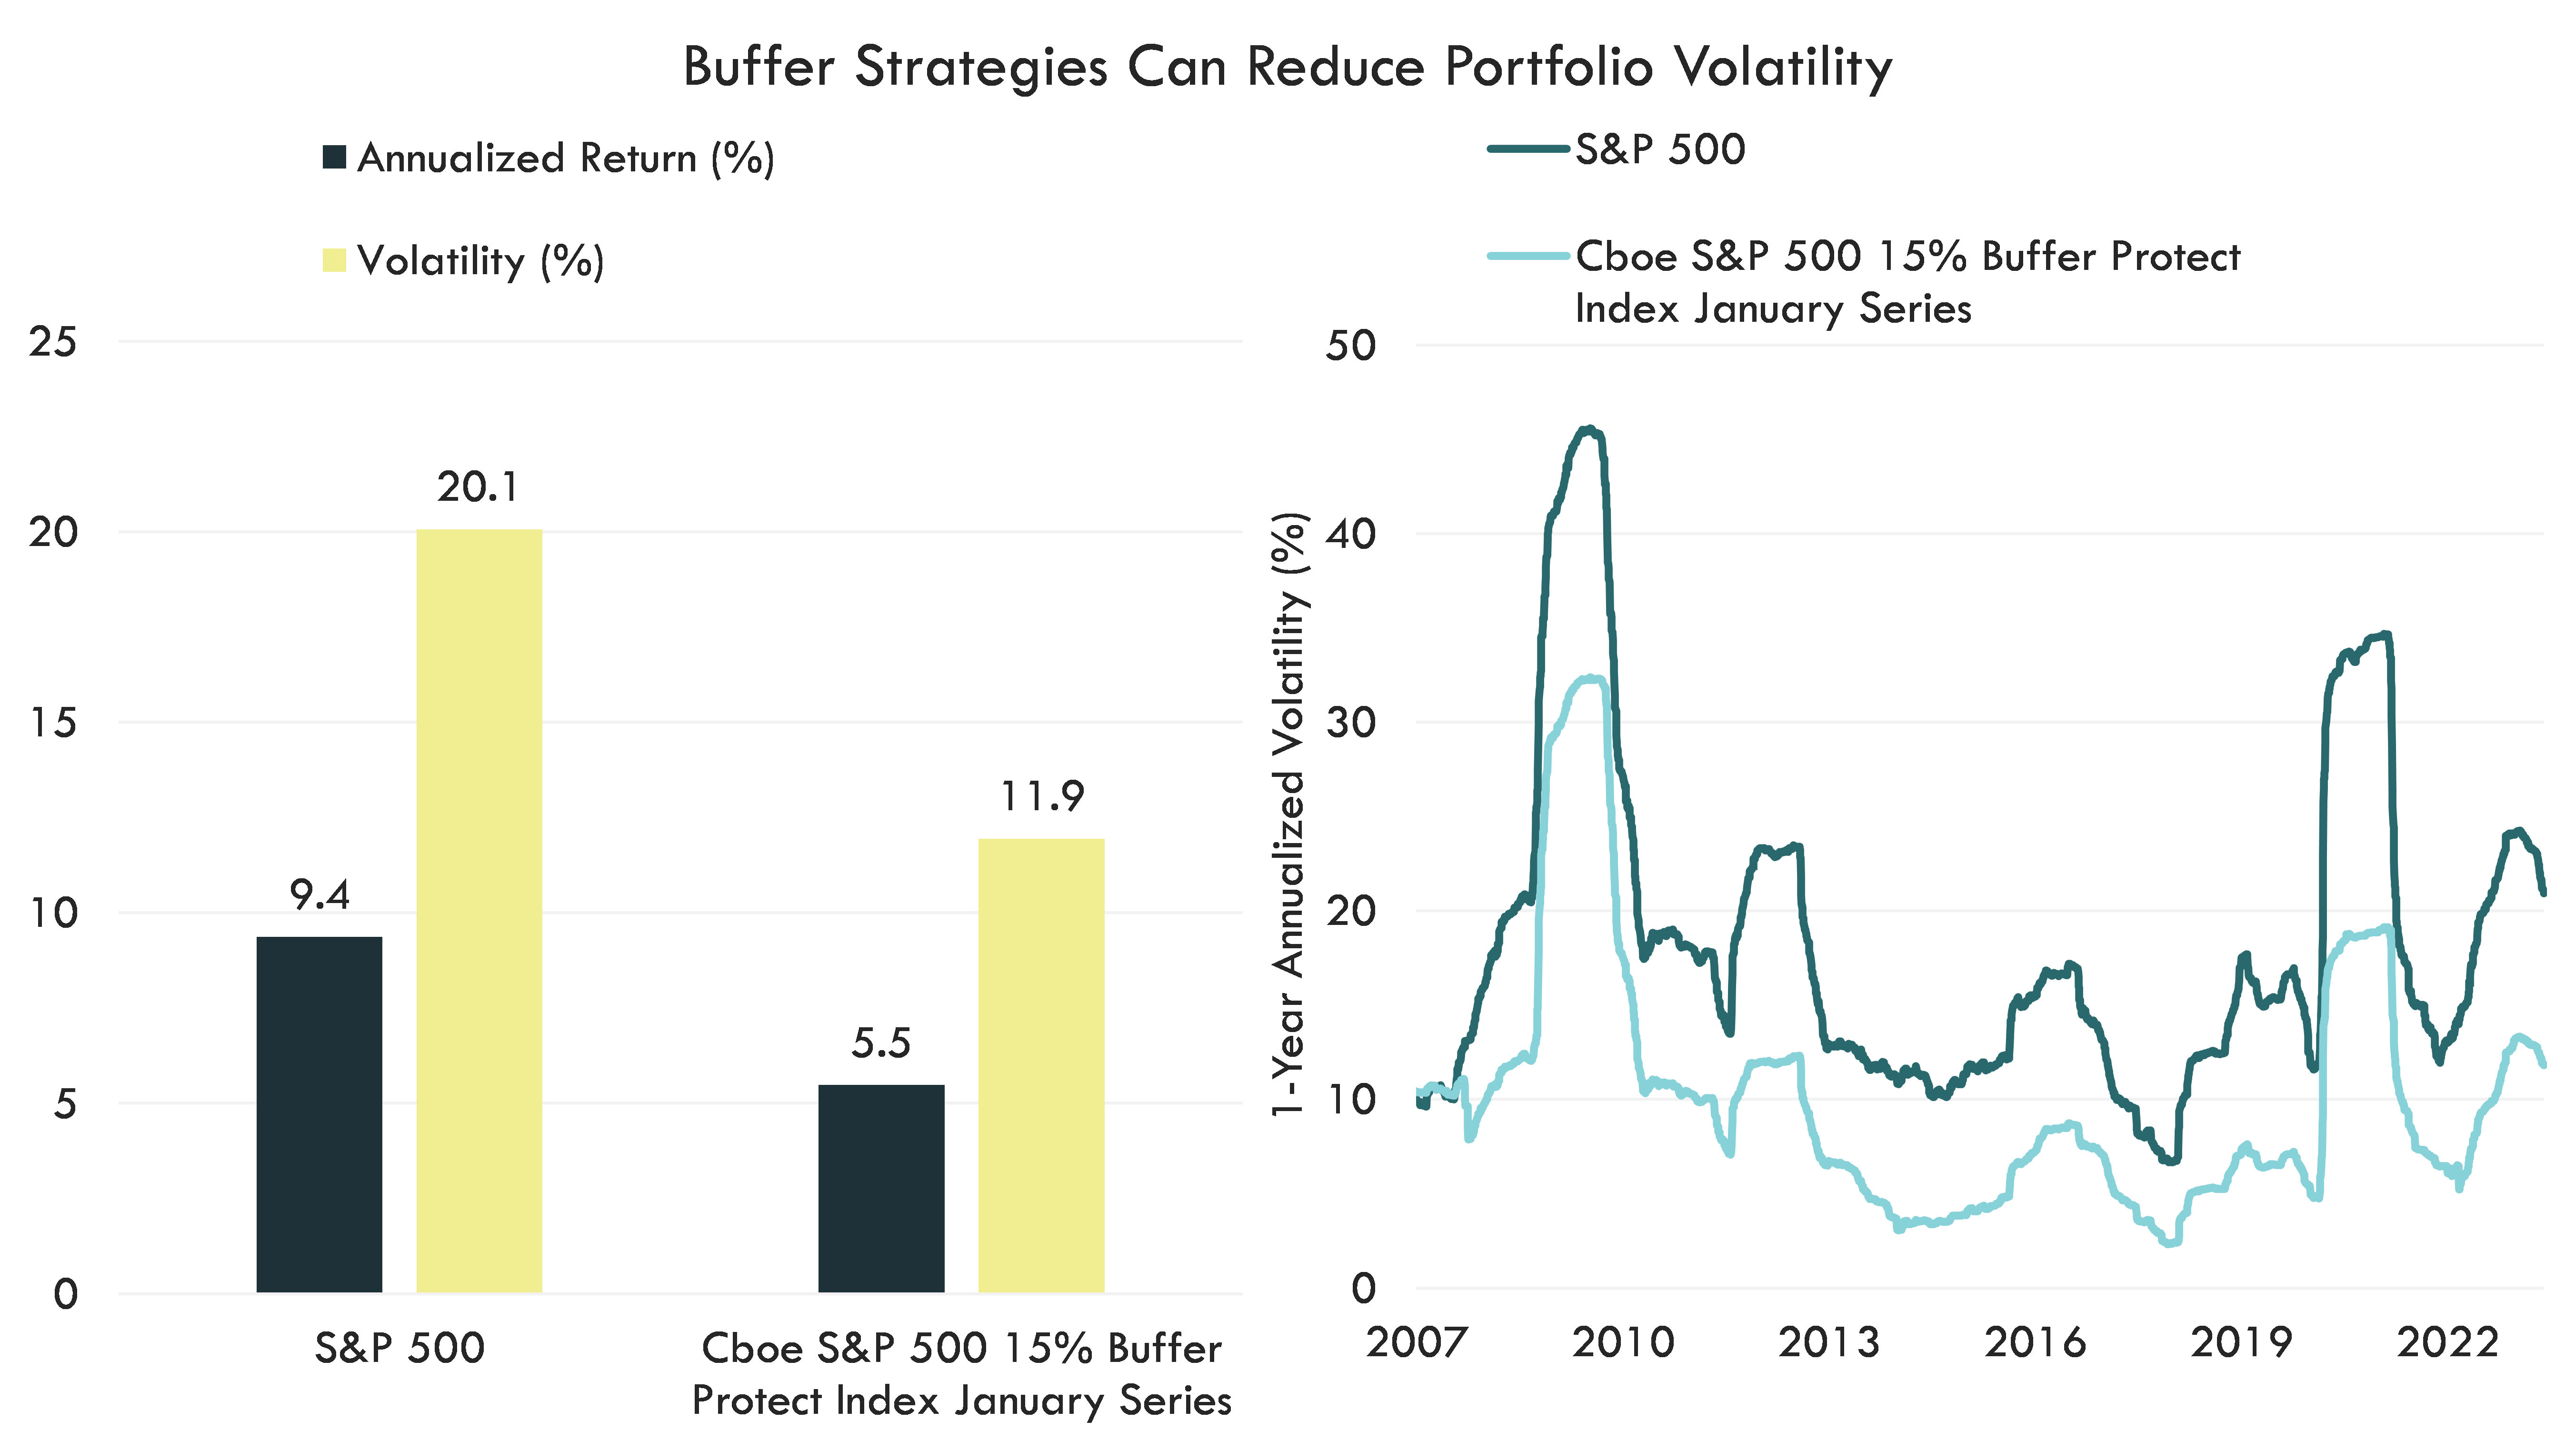
Source: Bloomberg, S&P, CBOE, Innovator Research and Investment Strategy. Daily data from 1/3/2006 – 5/31/2023.
Where to Allocate Buffer Strategies?
Many investors appreciate the risk management capabilities of buffer strategies but are unsure of where to allocate them in portfolios. Fixed income investments often are used to diversify portfolios and lower risk. Buffer strategies similarly seek to provide diversification and risk mitigation, but the underlying equity exposure has allowed these strategies to potentially outperform bonds over the long run. Therefore, we believe investors should consider funding buffer positions from the fixed income sleeve or the lower-risk risk asset portion (high yield bonds, preferred stock, emerging market debt, etc.) of the portfolio. If the past is any guide, funding buffered strategies from the fixed income sleeve has historically reduced portfolio volatility relative to U.S. equities, but allowed for higher upside participation than traditional fixed income strategies. As seen in the table below, 15% buffer strategies on the S&P 500 have a greater annualized performance compared to core bonds going back to the start of 2006. An even greater outperformance of 15% U.S. equity buffers exists during low-rate environments.
Source: Bloomberg, S&P, Innovator Research & Investment Strategy. U.S. Equities = S&P 500. 15% U.S. Equity buffer strategy = CBOE S&P 500 15% Buffer Protect Index January Series. Core Bonds = Bloomberg U.S. Aggregate Bond Index. Monthly data from 12/29/2006 - 5/31/2023. Past performance does not guarantee future results.
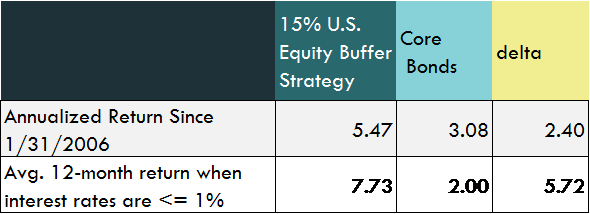
Source: Bloomberg, Innovator Research & Investment Strategy. Interest rates are proxied by the Fed funds rate upper limit. Data from 1/31/2006 -5/31/2023. 15% U.S. Equity buffer strategy = CBOE S&P 500 15% Buffer Protect Index January Series. Core Bonds = Bloomberg U.S. Aggregate Bond Index. Past performance does not guarantee future results.
Outcome periods with mid-double-digit caps may lead investors to cut out a portion of both equity and bond sleeves for buffer strategies. We are coming off a decade of low caps as the Federal Reserve’s Zero-Interest-Rate-Policy held caps at below historic medians. With Interest rates at normalized levels, we expect caps to remain at these higher levels in the short to intermediate time horizon.
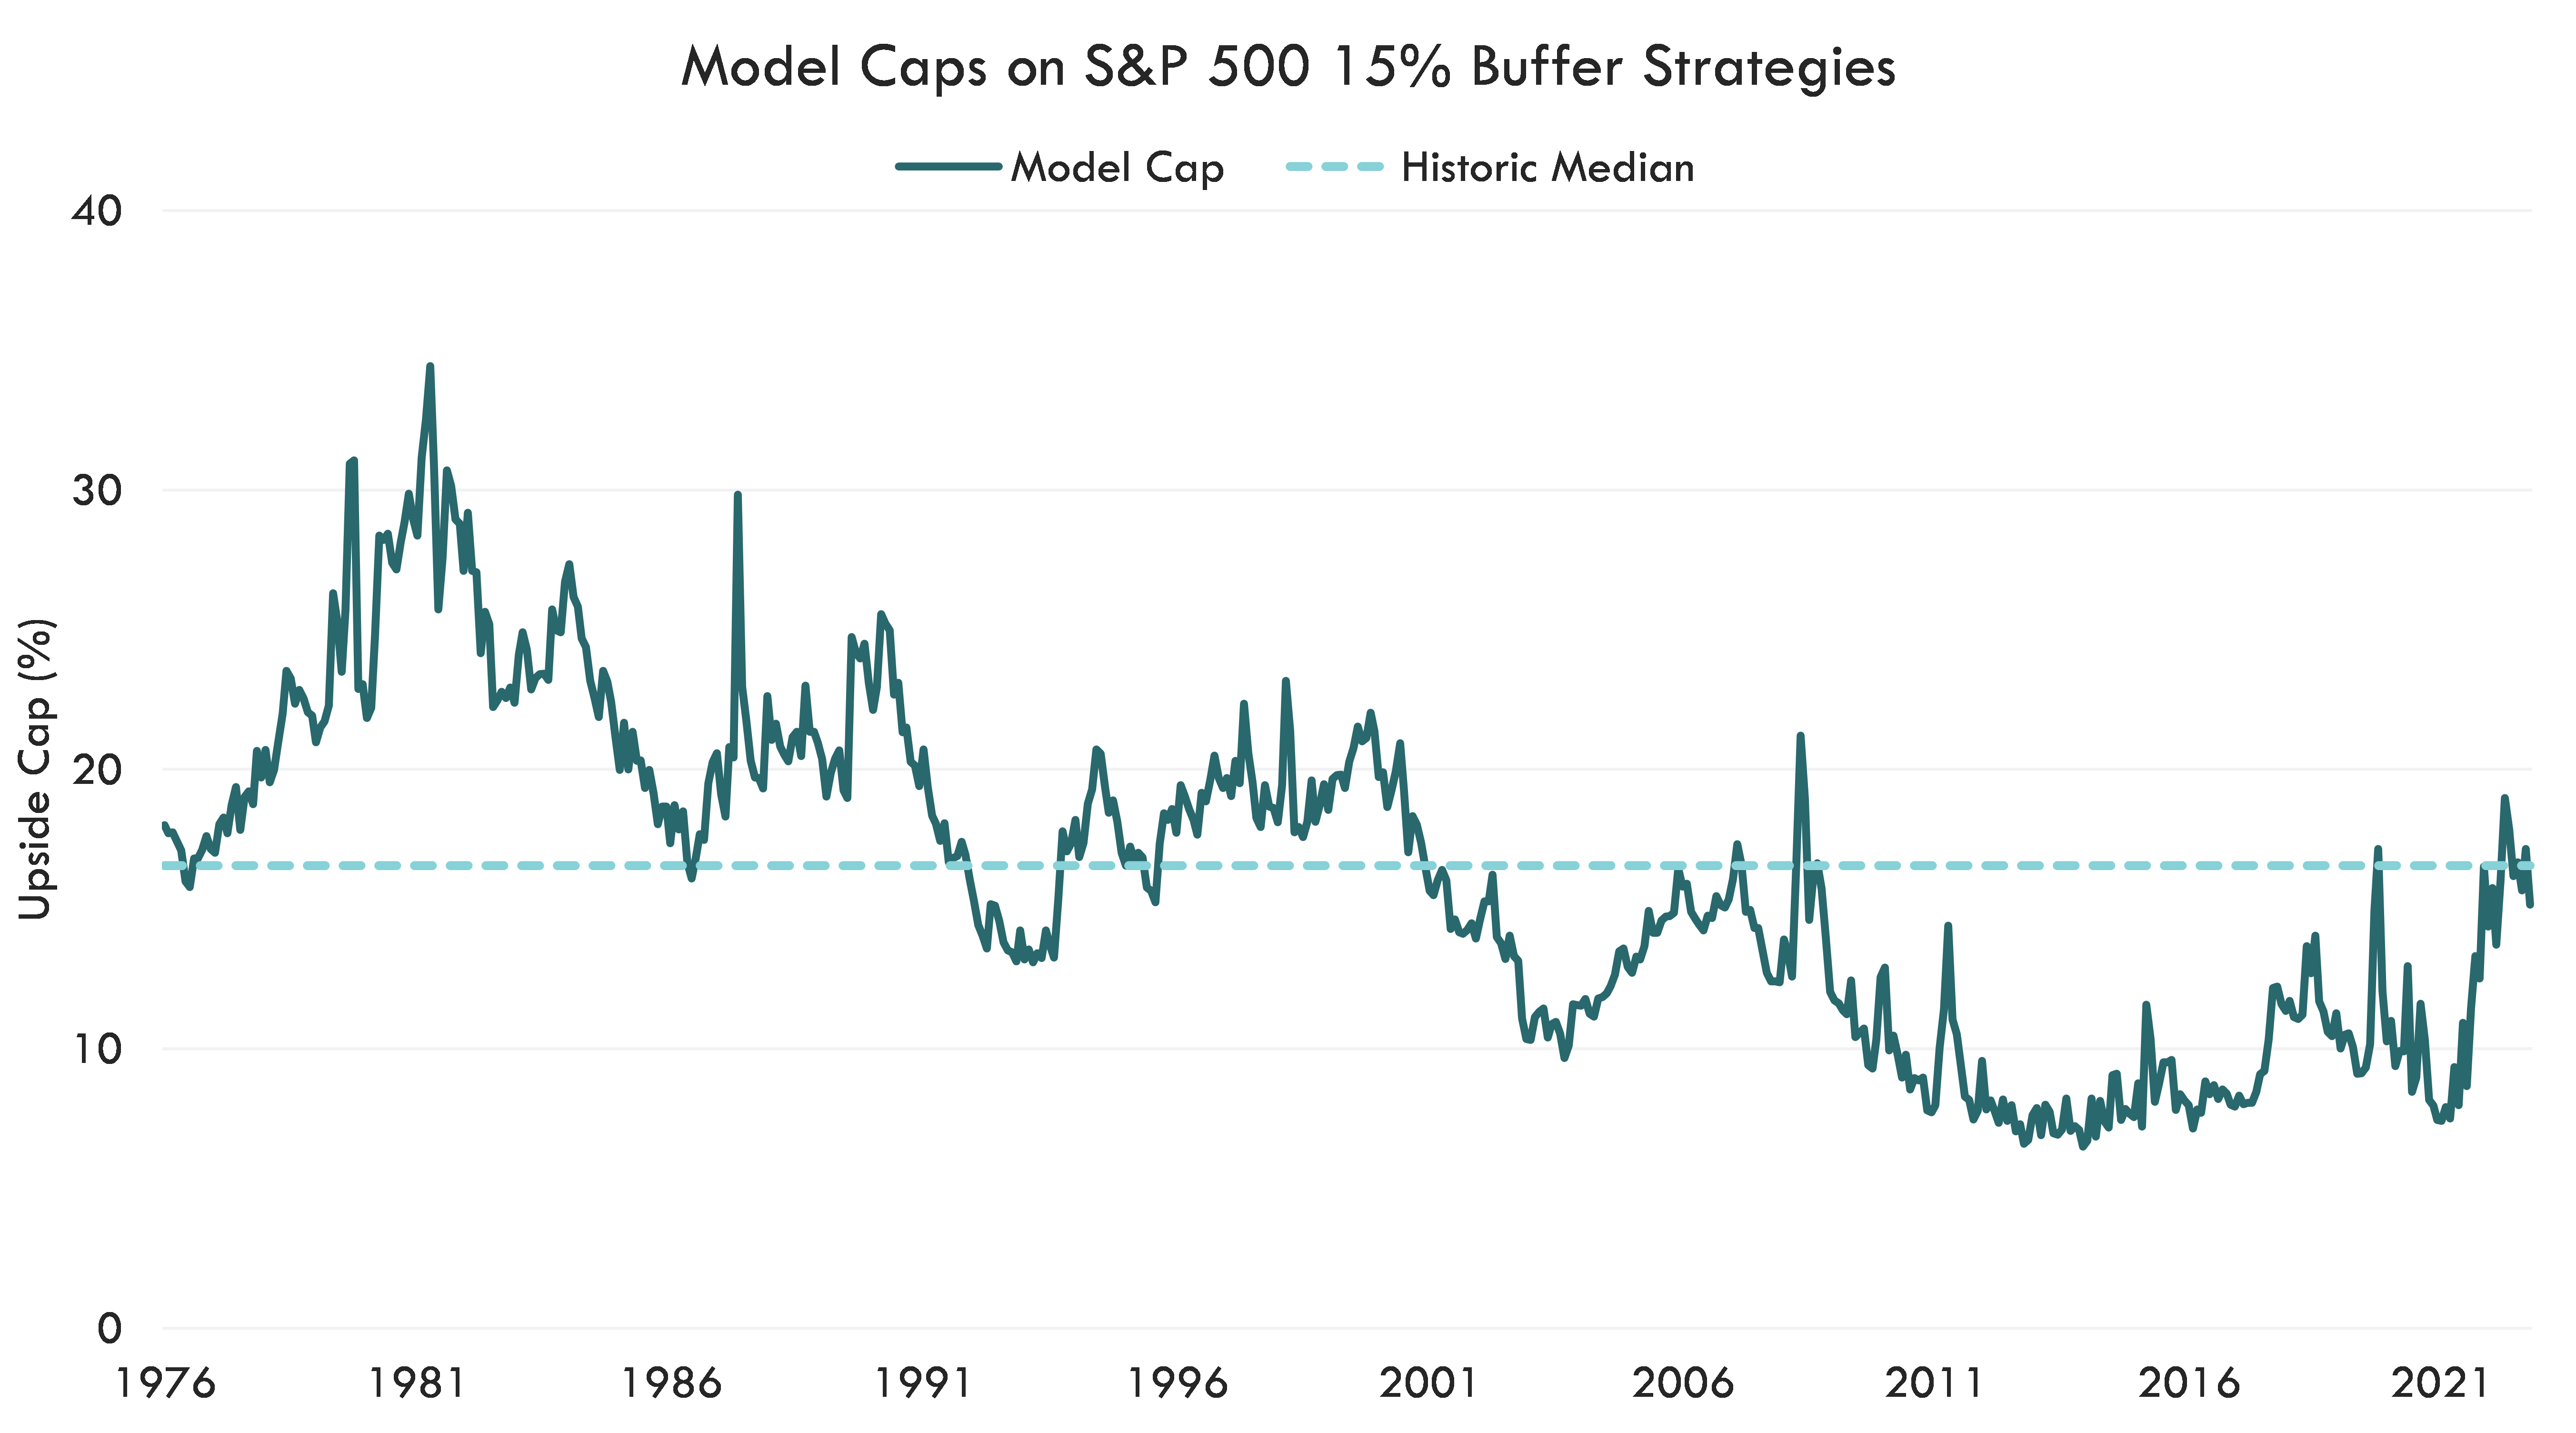
Source: Bloomberg, Innovator Research & Investment Strategy. Model caps are based on a regression analysis of CBOE’s volatility index, the 2-year treasury yield, and volatility of the S&P500 the week before a cap reset. These coefficients are modeled from 6/30/1976 – 5/31/2023.
Bottom Line
Buffer strategies can help diversify portfolios across a variety of market environments. Regardless of where investors position buffer strategies within the portfolio, the strategies are designed to provide known levels of downside risk mitigation and exposure to the market’s upside potential.
The S&P 500® is an index representing large-cap U.S. equities
The Bloomberg US Aggregate Bond Index, or the Agg, is a broad base, market capitalization-weighted bond market index representing intermediate term investment grade bonds traded in the United States.
The S&P 500® Low Volatility Index measures performance of the 100 least volatile stocks in the S&P 500
Covid-19 drawdown – 2/19/2020 – 3/23/2020
The Cboe S&P 500 15% Buffer Protect Index Series are designed to provide target outcome returns to the US domestic stock market.