March 23, 2022
A Market Without Direction: Dissecting Volatility
Burke Ashenden
ETF Products & Capital Markets Manager
Innovator Capital Management
As we observe markets in 2022, it’s no secret that volatility is high and consumer confidence is low. Perhaps what’s more concerning, however, is that the market seems to have lost its sense of direction. Every day we witness dramatic intraday moves as the market tries to process a barrage of geopolitical factors in a rapid, digital age. The war in Ukraine, the corresponding sanctions, inflation, energy shortages (compounding pre-existing inflation), and rising rates have left investors with a frenzy of factors to consider. While the urge to raise cash may seem prudent, history shows us that staying invested is the answer.
A stock’s value is derived from its discounted future cash flows, and that discount rate has been stapled to the ground for a long-time which has elevated valuations. Enter inflation and now the Fed is raising rates, which obliterated high-flying stocks that benefited from this phenomenon. Then, enter geopolitical conflict in Ukraine which has extremely serious implications for the globe but seemingly minimal implications for Fed policy. So, investors are left between a rock and a hard place. The Fed will continue to raise rates to combat inflation (which has now been supercharged by commodity prices) while growth may simultaneously stall/slow from sanctions. Stagflation is worst case scenario, but US equities may very well remain robust as they often do in the face of challenge.
Equity Performance During Rate-Hike Regimes
Examining 10 previous rate-hike cycles, stocks finished positive 70% of the time 12 months after the first hike with a median return of 3.3% and average return of 4.9%.
Although stocks generally finish positive during rate-hike cycles, keep in mind that inflation is >2.5x higher this go-around (7.9% vs. 3% average). Starting yields (as measured by the 10-year yield) are also the lowest among all scenarios analyzed (2.2% vs. 6.5% average).
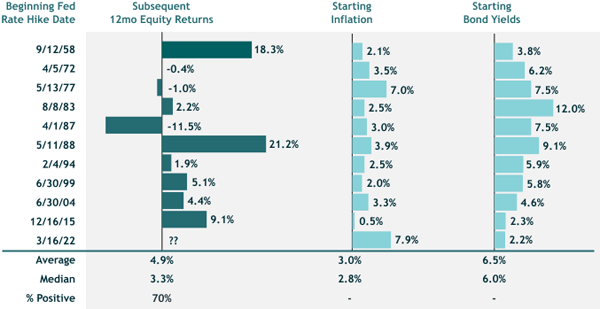
Past performance is not indicative of future results. Source: Bloomberg L.P., LPL Research as of March 17th, 2022. Stocks measured by the S&P 500 Index, Inflation by the CPI Index and Bond Yields by the 10-YR U.S. Treasury Yield.
For investors that are concerned about the future but want to remain invested, Defined Outcome ETFs may offer a compelling solution. The 12-Month average (4.9%) + median (3.3%) returns after the first rate-hike are below the starting upside cap for Innovator’s March Power Buffer ETF (PMAR), which seeks to provide 1:1 upside to SPY’s price return (to a 11.71% cap) with a downside buffer against the first 15% of losses over a 12-month outcome period. While mitigating downside risk is important, providing upside exposure isequally important. Going to cash in this environment may remove equity risk, but doesn’t save investors from the silent killer: inflation.
Putting #s to 2022’s Volatile Ride
Investors are rightfully struggling to process not only primary effects, but also the second/third order effects of war, inflation, commodity shortages, rising rates etc. In previous market cycles, volatility was commonplace. However, many have discounted volatility with the recent bull run (accompanied by historically low vol) and let natural position overweights to equity (especially technology) ride. And why not? It was working.
Now, however, there are multiple headwinds that suggest future returns may not resemble past returns. Advisors are rightfully adding guardrails to client portfolios while staying invested.
As evidence to the market’s lack of direction, we analyzed historical intraday price swings for the S&P 500 to get an idea of just how whippy this market has been. Since 1929, the S&P 500 index has averaged 1.3% intra-day price movement. During the most recent bull-run, the average intraday S&P move was < 1%. Since Russia invaded Ukraine, the S&P 500 is averaging 2.4% moves intraday. This puts us in the 90th percentile going back to the inception of the index. YTD, we are averaging > 2% intraday moves. These are uncertain times and attempting to time this market is a feeble endeavor. In our view, remaining invested with known downside buffer is the sensible solution
Fun fact: According to the data, the largest intraday swing in the S&P 500 was on October 19th, 1987 – Black Monday @ 20.5%! Second place was Black Tuesday (October 29th, 1929) @ 15.9%
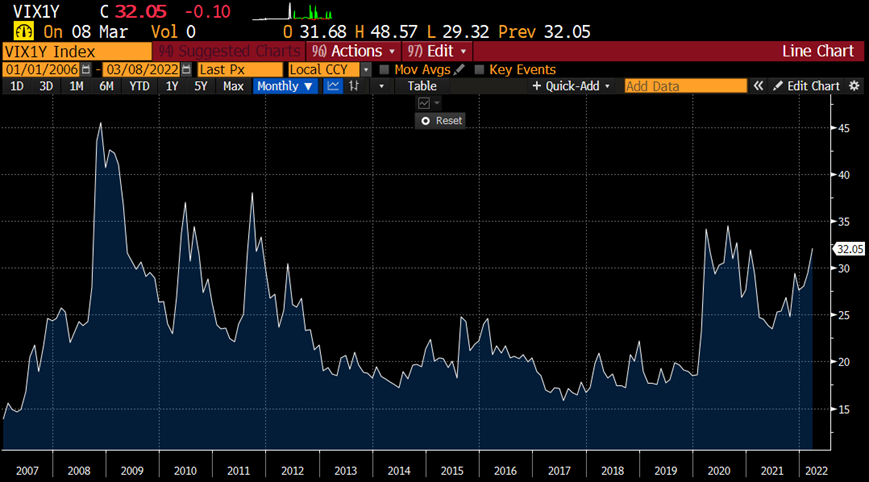
Volatility and Upside Caps
Lastly, investors often ask about volatility as it relates to upside cap levels that investors receive for Defined Outcome ETFs. While volatility has certainly been a driving factor for caps (higher volatility generally equates to higher upside caps), dividend & bond yields have also been key drivers
Analyzing 1-Year VIX (a key driver of Defined Outcome ETF caps), we are not quite at COVID levels, but getting close. The positive relationship between volatility and caps means that investors have historically benefitted via higher upside potential when volatility is elevated.
In conclusion, the current price action across bell-weather indices indicates that no one has a confident thesis for the intermediate-term future. Cooler heads prevail and staying invested with a known buffer against loss is a prudent strategy for investors. Instead of trusting individual manager prowess, trend-following, or black-box approaches to risk-management, we continue to witness investors embrace Defined Outcome ETFs as the tax-efficient, liquid, and transparent approach to risk-management
ETFs use creation units, which allow for the purchase and sale of assets in the fund collectively. Consequently, ETFs usually generate fewer capital gain distributions overall, which can make them somewhat more tax-efficient than mutual funds.
Median: The middle number in a sorted list of numbers
VIX: The CBOE Volatility Index, VIX, is a real-time market index representing the market's expectations for volatility over the coming 30 days.
The funds only seek to provide their investment objective, which is not guaranteed, over the course of an entire outcome period. Investors who purchase shares after or sell shares before the end of an outcome period will experience very different outcomes than the funds seek to provide.
The Funds have characteristics unlike many other traditional investment products and may not be suitable for all investors. For more information regarding whether an investment in the Fund is right for you, please see Investor Suitability" in the prospectus
The Funds are designed to provide point-to-point exposure to the price return of a reference asset via a basket of Flex Options. As a result, the ETFs are not expected to move directly in line with the reference asset during the interim period. Additionally, FLEX Options may be less liquid than standard options. In a less liquid market for the FLEX Options, the Fund may have difficulty closing out certain FLEX Options positions at desired times and prices.
Fund shareholders are subject to an upside return cap (the Cap) that represents the maximum percentage return an investor can achieve from an investment in the funds' for the Outcome Period, before fees and expenses. If the Outcome Period has begun and the Fund has increased in value to a level near to the Cap, an investor purchasing at that price has little or no ability to achieve gains but remains vulnerable to downside risks. Additionally, the Cap may rise or fall from one Outcome Period to the next. The Cap, and the Fund's position relative to it, should be considered before investing in the Fund. The Funds' website, www.innovatoretfs.com, provides important Fund information as well information relating to the potential outcomes of an investment in a Fund on a daily basis.
The Funds only seek to provide shareholders that hold shares for the entire Outcome Period with their respective buffer level against reference asset losses during the Outcome Period. You will bear all reference asset losses exceeding the buffer. Depending upon market conditions at the time of purchase, a shareholder that purchases shares after the Outcome Period has begun may also lose their entire investment. For instance, if the Outcome Period has begun and the Fund has decreased in value beyond the pre-determined buffer, an investor purchasing shares at that price may not benefit from the buffer. Similarly, if the Outcome Period has begun and the Fund has increased in value, an investor purchasing shares at that price may not benefit from the buffer until the Fund's value has decreased to its value at the commencement of the Outcome Period.
The Funds' investment objectives, risks, charges and expenses should be considered carefully before investing. The prospectus contains this and other important information, and it may be obtained at innovatoretfs.com. Read it carefully before investing.
Innovator ETFs are distributed by Foreside Fund Services, LLC.